
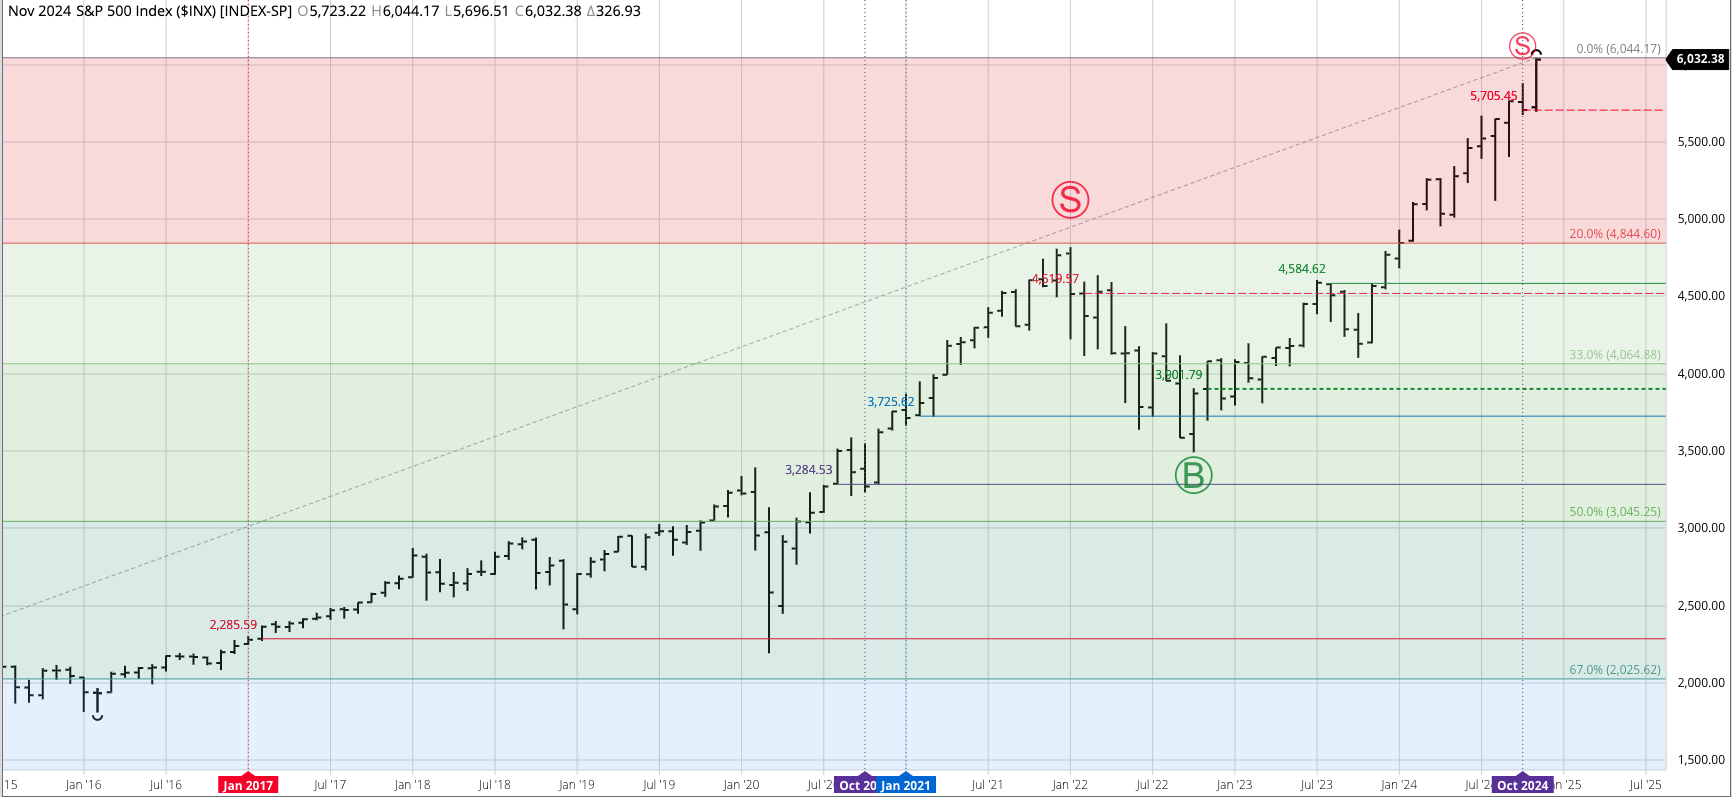


The S&P 500 ($INX) resumed its previous major (long-term) uptrend during November, posting a new all-time high of 6,044.71 before closing at 6,032.38, up 326.93 for the month. Technically, this erased the bearish spike reversal completed during October. Theoretical Positions: Previous long positions from the October 2022 close of 3,871.98 would’ve been sold near the October 2024 close.
The Dow Jones Industrial Average ($DOWI) hit a new all-time high of 45,071.29 during November, erasing the bearish spike reversal completed at the end of October. Theoretical Positions: Previous long positions from the October 2022 close of 32,732.95 would’ve been sold near the October 2024 close.
The Nasdaq ($NASX) jumped to a new all-time high of 19,364.98 during November. This erased previous technical signals of a move to a major downtrend. Theoretical Positions: Longs from the October 2022 close of 10,988.15 would have been liquidated near the July close of 17,599.40, locking in a gain of roughly 6,611. Previously established short positions would’ve been stopped out during November.
The US 10-year T-note (ZN) remains in a major uptrend with November’s activity completing a bullish spike reversal. The monthly close of 111-005 was higher for the month, indicating the low of 108-300 is a Wave 4 trough setting the stage for a Wave 5 rally. This would be confirmed with a move beyond the Wave 3 high of 115-070 (September 2024). Theoretical Positions: New longs might’ve been established near the November 2023 close of 109-150. Additional positions could’ve been established near the April close of 107-140. Another round of long positions could’ve been put in place during August as the ZN took out its Wave 1 high. Additional longs could be established near the November close, raising the overall position average to roughly 110-250.


