


Side Note: For the record, I continue to agree more with Warren Buffett’s thoughts on technical analysis, “I realized that technical analysis didn’t work when I turned the chart upside down and didn’t get a different answer.” However, I will continue to post analysis, at least through this financial quarter ending in June. Talking with a friend in the industry Wednesday afternoon, and we were in agreement I may have to apply the Horseshoe Proximity (Close is close enough) to US stock indexes in this month’s analysis.
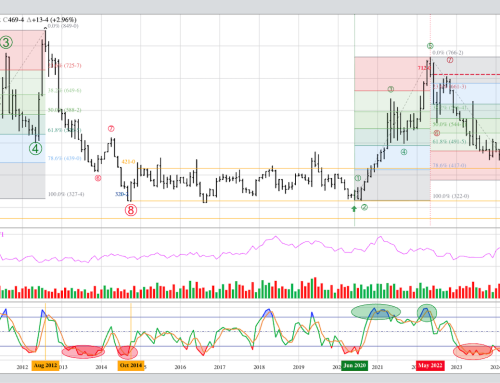
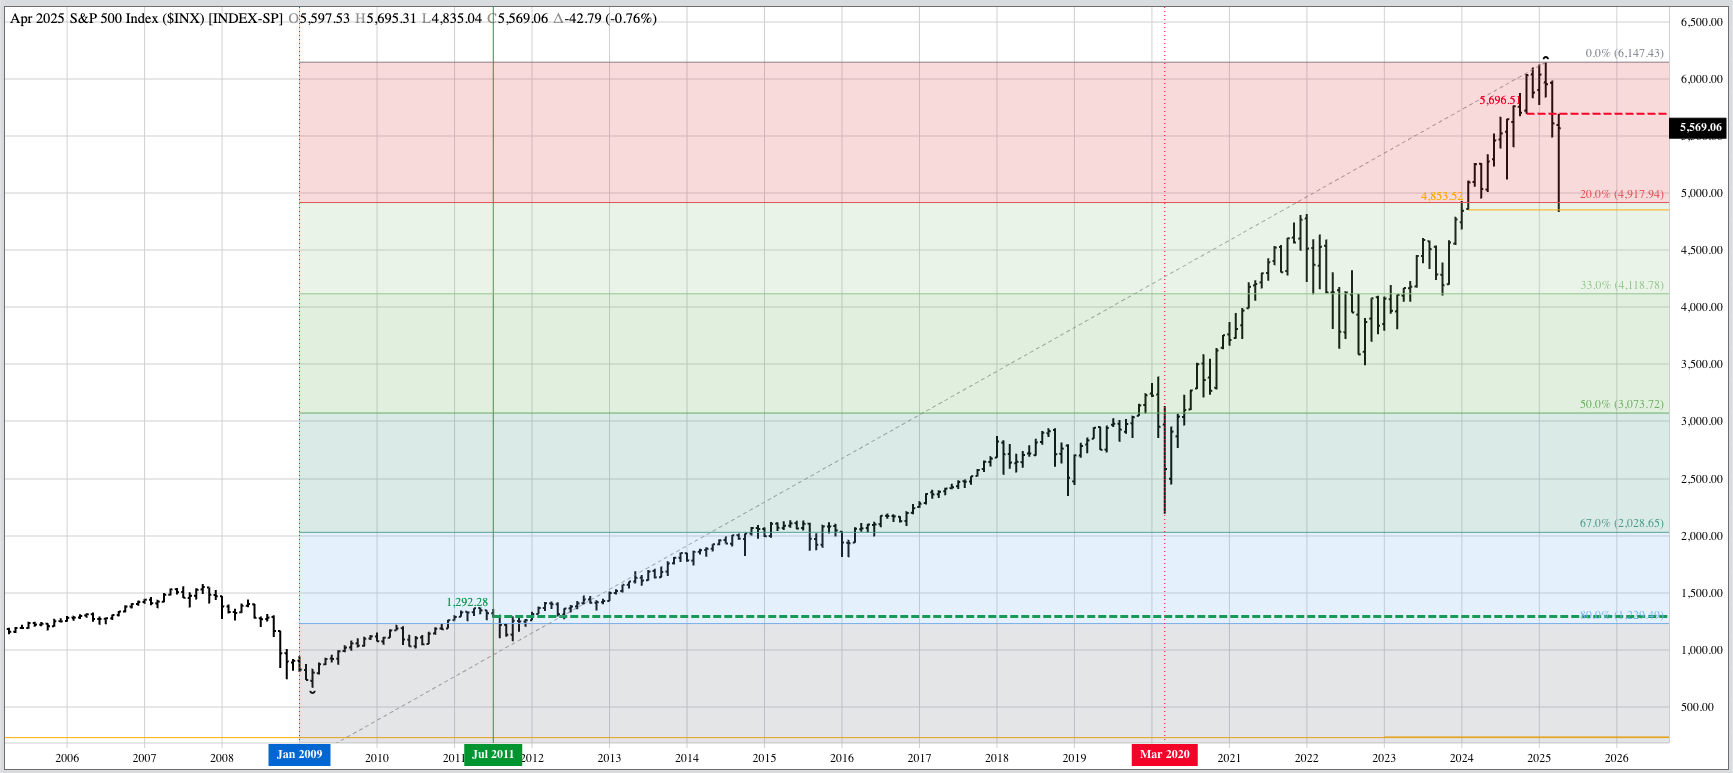
The S&P 500 ($INX) extended its major (long-term) downtrend to a low of 4,835.04 during April, its lowest level since January 2024. This was also a loss of 21%, by classic analysis moving the Index into bearish territory. But then a funny thing happened: The S&P 500 immediately turned and roared higher, closing the month at 5,569.06, down only 42.79 (0.8%) for the month. Add to that early Thursday (May 1) sees the Index up 78 points (1.4%). Was the April settlement close enough to unchanged to count it as a bullish spike reversal? Or will the wild swings continue during May based on the old saying, “Sell in May and walk away”? Time will tell. Theoretical Positions: Long-term investors may have followed Warren Buffett’s lead and moved to cash given all the uncertainty in the S&P 500.
The Dow Jones Industrial Average ($DOWI) extended its major downtrend to a low of 36,611.78 during April, its lowest level since December 2023 and a loss of 19% from its December 2024 high of 45,073.63. Technically, the DJIA did not reach bear territory with a 20% loss, unless we again apply the Horseshoe Proximity. The DJIA settled April at 40,669.36, down 1,332.40 (3.2%) for the month before opening May with a gain (so far) of 354 points (0.9%). Theoretical Positions: Long-term investors likely sold or protected their position as the DJIA confirmed a major downtrend the past number of months.
The Nasdaq ($NASX) was more interesting than the other two major indexes as it came storming back in late April to close 17,446.34, up 147 points (0.9%) higher for the month. Do we believe what we see? Was this actually a bullish spike reversal indicating the major trend has turned up again? It’s hard to say. Early Thursday (May 1) sees the Nasdaq up another 445 points (2.6%). Theoretical Positions: Long-term investors might’ve bought back into high-tech stocks late in April as the Index made its impressive run. Others likely stayed on the sidelines, or moved more of their portfolio to cash.
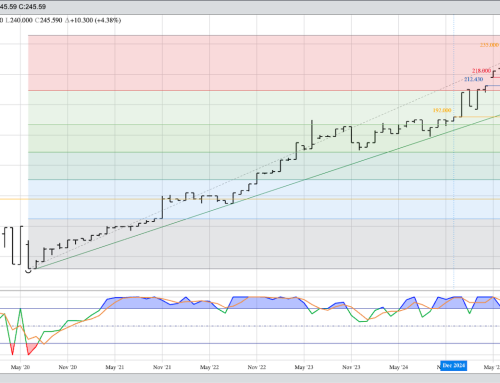
The US 10-year T-note (ZN) is not as clear a read as it has been since the completion of the bullish 2-month reversal during October and November of 2023. For now, though, I’ll continue to call the major trend up based on the definition of higher highs and higher lows, until the ZN takes out its previous 4-month low of 107-060 from January 2025. It’s interesting to note ZN remains unable to take out its previous high of 115-070 from September 2024. If the US Fed is forced to raise interest rates to fight inflation tied to trade wars and tariffs, longer-term US Treasury instruments could come under increased pressure. Theoretical Positions: New longs might’ve been established near the November 2023 close of 109-150. Additional positions could’ve been established near the April 2024 close of 107-140. Another round of long positions could’ve been put in place during August 2024 as the ZN took out its Wave 1 high. Additional longs could be established near the November close, raising the overall position average to roughly 110-250. Investors could’ve added long positions on a move beyond the previous 4-month high of 111-155 (December) during March. Sell stops would be below the January low of 107-060.