The S&P 500 ($INX) remains in a major (long-term) downtrend, despite the higher monthly close to March. The secondary (intermediate-term) uptrend on the $INX weekly chart looks to be Wave B (second wave) of the major 3-wave downtrend pattern meaning the $INX would be expected to eventually take out the Wave A low of 4,114.65 from February. It’s interesting to note last week was the third consecutive higher weekly close, bringing to mind the Benjamin Franklin Fish Similarity (Like guests and fish, markets tend to stink after three days/weeks/months of moving against its prevailing trend). Still, a characteristic of Wave B can be a strong retracement of Wave A, meaning a test of the major high of 4,818.62 is not out of the question.
The US 10-year T-note (ZN) extended its major (long-term) downtrend to a low of 120-035 during March, the lowest the ZN has been since December 2018, before closing within sight of its low for the month at 122-280. Meanwhile, monthly stochastics are holding in single digits, continuing to show a sharply oversold situation. While the ZN could try to consolidate over the coming months, it risk still looks to be to the downside with possible sell stops below the March low. However, the ZN did appear to post a bullish spike reversal on its weekly chart indicating its secondary (intermediate-term) trend may have tried to turn up.
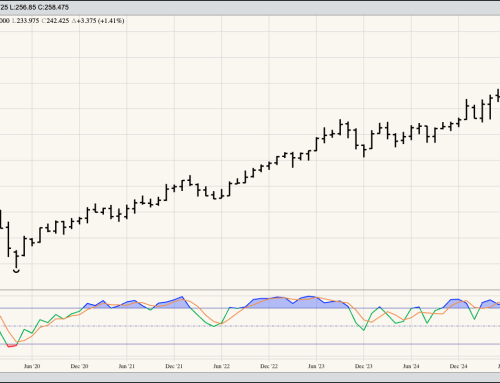
Gold remains a difficult read with the monthly chart for the June contract not showing a clear pattern. That having been said, the tendency has been toward high highs and higher lows, the definition of an uptrend. June gold posted a high during March of $2,082.00 before closing the month at $1,954.00. The contract’s secondary (intermediate-term) trend is also unclear, though it did post a new 4-week low of $1,893.20 last week before closing $36.10 below the previous Friday’s settlement. This would indicate the contract could see follow-through selling next week.
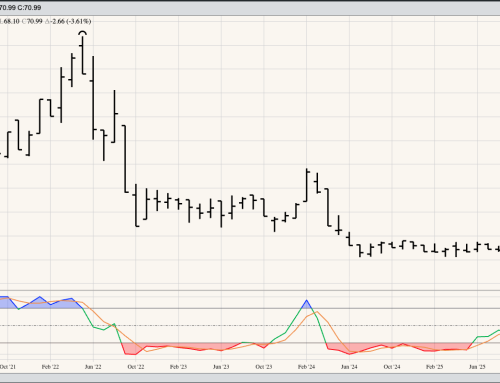
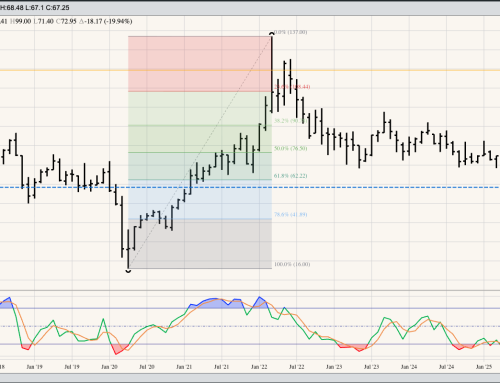
WTI Crude Oil is another difficult market to read. The spot-month contract spiked to a high of $130.50 during March, its highest level since July 2008. And while the market’s forward curve remains inverted, indicating long-term fundamentals are still bullish, the market closed the month at $100.28. Despite the dramatic break from the high it was still up $4.56 from February’s settlement. The obvious conclusion is the market remains in a major (long-term) uptrend, though monthly stochastics are indicating momentum is growing less bullish. Additionally, the market’s secondary (intermediate-term) trend turned down with the completion of a bearish spike reversal the week of March 7. Initial support heading into next week is at the previous 4-week low of $93.53.