


Note: I’ve changed the Monthly Analysis of the Grains sector, looking at the long-term investment side with ETFs for the three major markets as well as continuous December corn and November soybeans monthly charts. I’ll discuss the National Cash Indexes for the five major markets (corn, soybeans, three wheats) in Monthly Supply and Demand Commentary based on the idea these Indexes are the key read on real fundamentals.
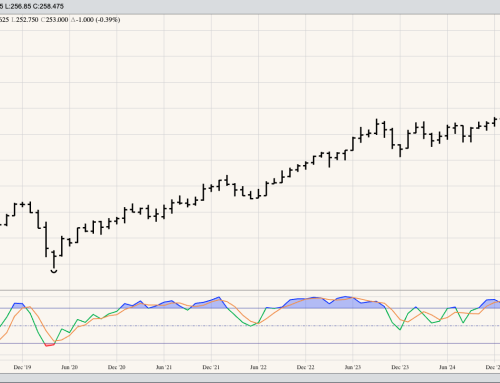
Teucrium Corn Fund (CORN) extended its major (long-term) uptrend to a high of $20.69 during February before closing at $19.07, down $0.72 for the month. The activity during February looked to be the peak of Wave 1 within the 5-wave uptrend pattern, meaning a test of the long-term low at $17.02 is possible with a Wave 2 selloff. Theoretical Positions: CORN could’ve been bought near the August settlement of $17.70. Additional longs could be established on buy stops above the previous 4-month high of $18.85 during January. If so, then the average position would be near $18.28. Sell stops would be left below the major low of $17.02 from August 2024 for now.
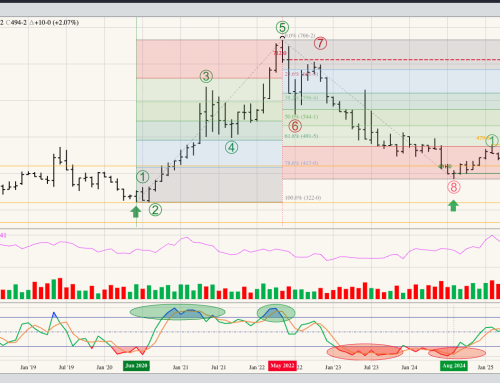
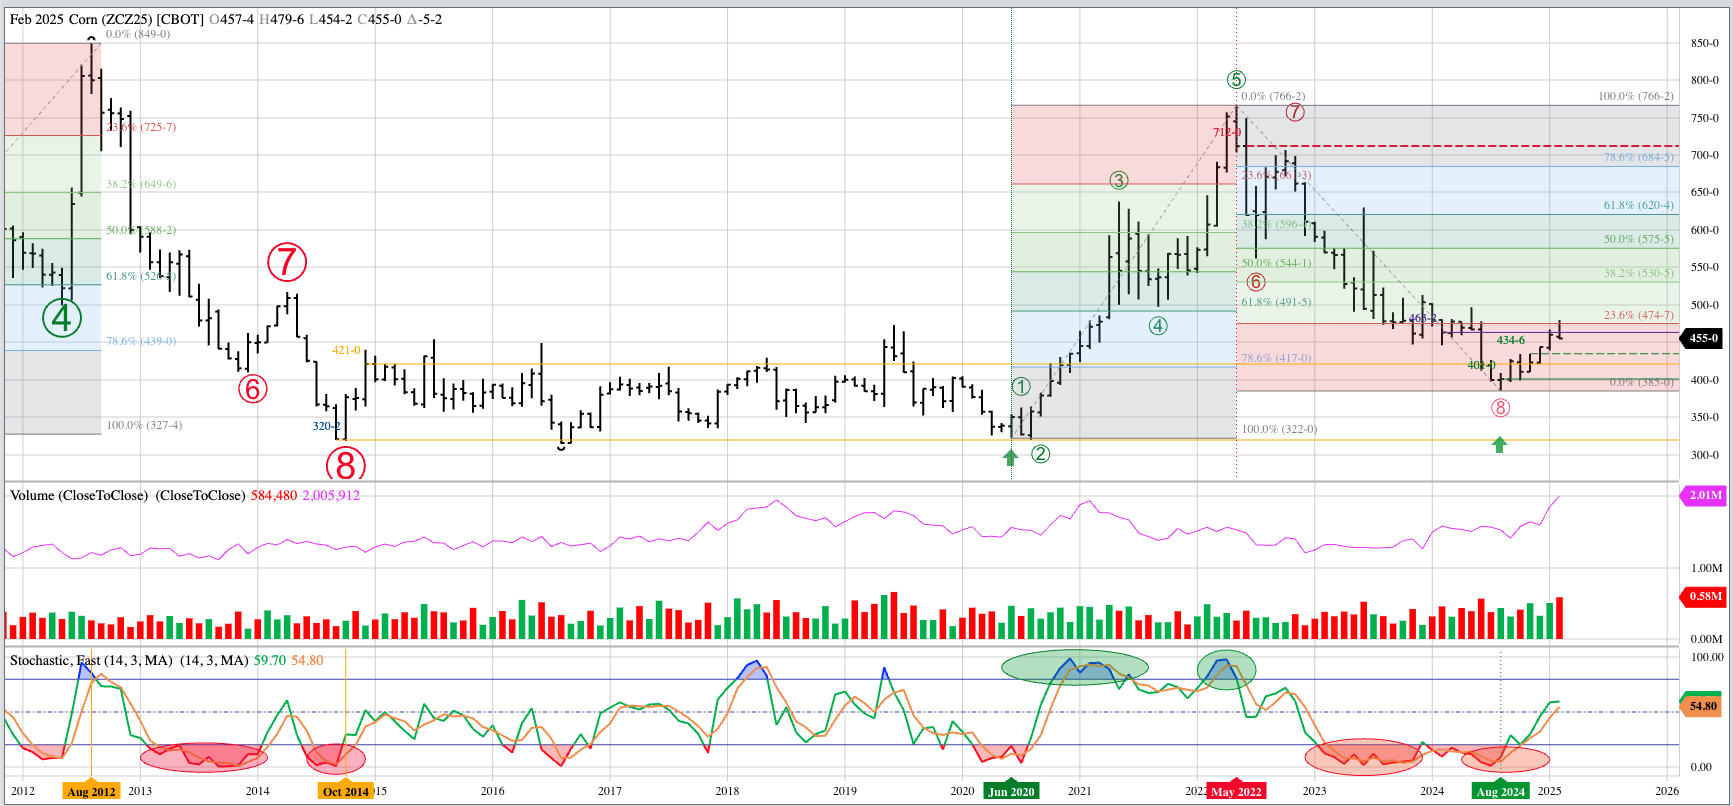
December Corn: There is a lot going on with the long-term continuous monthly chart for Dec Corn futures only. To begin with Dec25 posted a bearish close to February, finishing at $4.55, down 5.25 cents for the month. This after posting a high of $4.7975, one tick short of the round number $4.80 during the month. It’s possible Dec25 has established the high-end of a potential major (long-term) sideways range, similar to what occurred during the winter of 2014-2015. Recall this sideways pattern would last through the fall of 2020. If Dec corn is in a new major sideways trend with a high-end near $4.80, the low end would be the August 2024 low of $3.8550. The range back in 2014 to 2020 was from the low near $3.20 (September and October 2014) through the highs near $4.20.
Theoretical Positions:
- Hedgers:
- See Weekly Analysis: Grains (both Futures and Cash)
- Investors:
- Short Dec24 futures positions could’ve been covered near the August 2024 close of $4.01.
- And long positions established at the same price
- These long positions could’ve been rolled to Dec25 at a carry of 25.5 cents on Monday, October 28
- Dec24 was at (roughly) $4.1325
- Dec25 was at (roughly) $4.3875 (new long positions)
- Short-dated new-crop March call options could’ve been sold for 10 cents on February 10
- These options would’ve been exercised by the buyers at expiration on Friday, February 21
- Creating a short Dec25 futures position of $4.70 (The $4.60 option strike price plus 10.0 cents premium collected)
- Long Dec25 futures were rolled to Dec26 futures at 2.0 cents carry on Friday, January 31
- Dec25 could’ve been sold for roughly $4.6025
- a gain of approximately 21.5 cents
- in addition to the gain of about 12.0 cents on the previous Dec24 long futures position (see above)
- a gain of approximately 21.5 cents
- Dec26 could’ve been bought for roughly $4.6225
- This spread closed February at a carry of 1.25 cents
- Dec25 could’ve been sold for roughly $4.6025
- Short Dec24 futures positions could’ve been covered near the August 2024 close of $4.01.
- The bottom line is long-term Investors will want to still be long Dec corn based on the bullish spike reversal at the end of August on the continuous monthly chart confirming the end of the previous long-term downtrend from May 2022 (See Monthly Analysis). At the end of February the investment position would be approximately:
- Short Dec25 near $4.70
- Dec25 closed February at $4.55
- Long Dec26 near $4.6225
- Dec26 closed February at $4.5625
- Short Dec25 near $4.70
The Teucrium Soybean Fund (SOYB) extended its major uptrend to a high of $22.78 during February before closing at $21.53, down $0.63 for the month. Recall SOYB completed a bullish spike reversal at the end of December, turning the major trend up. Given this, February activity looks to be a Wave 1 peak leading to a Wave 2 selloff, within the 5-wave uptrend pattern. If so, then SOYB could test the December low of $20.20 over the coming months. Theoretical Positions: Investors would’ve bought near the December settlement of $21.48 with sell stops below the December low of $20.20. If options are available for SOYB, June $20 puts could be bought to protect against the Wave 2 selloff. Otherwise, investors could look at buying puts against the July futures contract. The $10.40 puts closed February at 36 4/8 cents.
November Soybeans: The continuous monthly chart for November soybeans continues to show a major sideways trend. It should be noted the Nov25 issue posted a new 4-month high beyond the previous marks of $10.66 (January) and $10.6975 (September 2024) before closing at $10.2950, down 21.5 cents for the month. Theoretical Positions: Traders would’ve gotten out of short November 2024 futures positions before the contract moved into delivery at the end of October. If buy orders were triggered with the new 4-month high, roughly $10.70, then sell stops would be below the previous 4-month low of $9.61. It’s also possible these new longs were stopped out at February’s lower close. I don’t have a good feel for Nov25 meaning new positions are on hold for now.
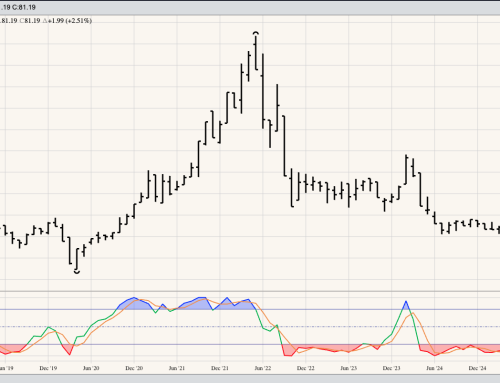
The Teucrium Wheat Fund (WEAT) remains in a major uptrend. However, there are some concerns. Technically, WEAT posted a bearish close to February, down $0.12 for the month after posting a new high for the move of $5.35. This could be considered a Wave 1 peak leading to a Wave 2 selloff, a move that could create a test of the January low of $4.64. Fundamentally, the SRW futures market that this ETF is based on is growing increasingly bearish, as indicated by new-crop futures spreads. Theoretical Positions: Investors might’ve gone long WEAT near the December settlement of $4.82. Additional longs could be established near the January settlement of $4.95, putting the average position near $4.89. Sell stops would be below the January low of $4.64.