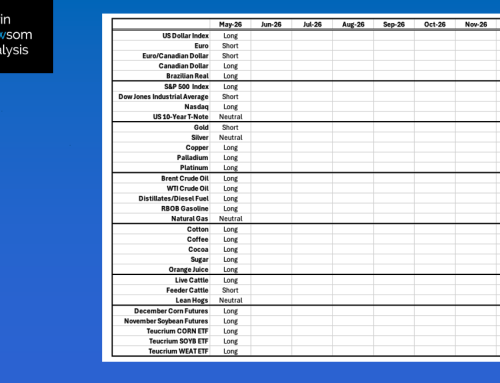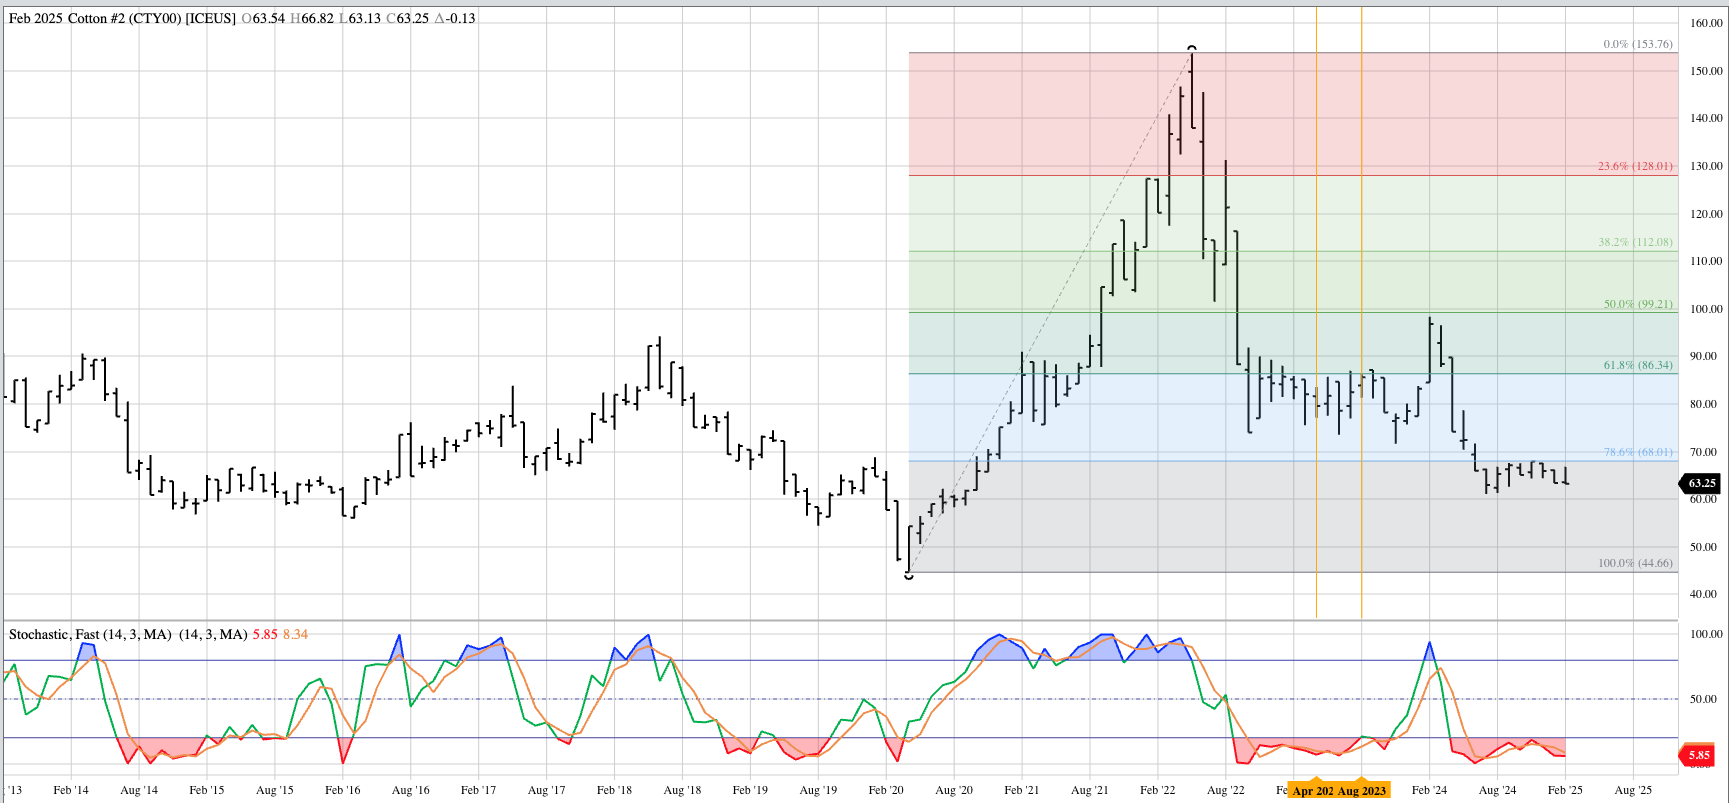


Cotton (CTY00, Cash Index): While the eyeball test tells us the major (long-term) trend is sideways, the Index did post a new 4-month high during November, possibly triggering some buying interest. However, the index then posted a new 4-month low during January before grinding lower again during February. For now, I’ll call the range between the July 2024 low of 61.07 and the November 2024 high of 67.93, basically between 61.00 and 68.00. Theoretical Positions: Long-term investors are likely on the sidelines in cotton at this time.
Coffee (KCY00, Cash Index): While the Index did not complete a bearish reversal pattern at the end of February, it was close. We could apply the Horseshoe Proximity that tells us “Close is close enough” and consider it a bearish spike reversal pattern. If so, then it would confirm a series of bearish crossovers by monthly stochastics above the overbought level of 80%, most recently at the close of February. Theoretical Positions: Long-term investors could look at going short coffee. The risk is the market remains fundamentally bullish, as indicated by the continued backwardation (inverse) in the futures forward curve. If shorts are established, sell stops would be placed above February highs (depending on which futures contract one uses).
Cocoa (CCY00, Cash Index: I’m not seeing a clear trend on the monthly chart for the Index. Meanwhile, the futures market’s forward curve remains in backwardation beyond the nearby March issue. Theoretical Positions: Long-term investors are likely on the sidelines in cocoa.
Sugar (SBY00, Cash Index): It could still be argued the Index is in a major uptrend based on the bullish spike reversal completed in August 2024 and again in January 2025. Given the latter had a low of 17.75, above the former’s mark of 17.57, it could be considered the bottom of a Wave 2 selloff within the major 5-wave uptrend pattern. However, after initially rallying during February the index closed at 18.50, down 0.9 for the month. Theoretical Positions: Long-term investors may have gone long the sugar market, futures or Exchange Traded Funds (ETFs) near the August 2024 close before adding positions near the January 2025 settlement. If so, sell stops would be below the August 2024 lows.
Orange Juice (OJY00, Cash Index: The monthly chart looks like something we’d see with natural gas (aka the Widow Maker). That being said, OJY00 did complete a bearish spike reversal at the close of September 2024, confirming a move to a major downtrend. Theoretical Positions: Long-term investors might’ve gone short the futures market near the September 2024 close.