


Note: I’ve changed the Monthly Analysis of the Grains sector, looking at the long-term investment side with ETFs for the three major markets as well as continuous December corn and November soybeans monthly charts. I’ll discuss the National Cash Indexes for the five major markets (corn, soybeans, three wheats) in Monthly Supply and Demand Commentary based on the idea these Indexes are the key read on real fundamentals.
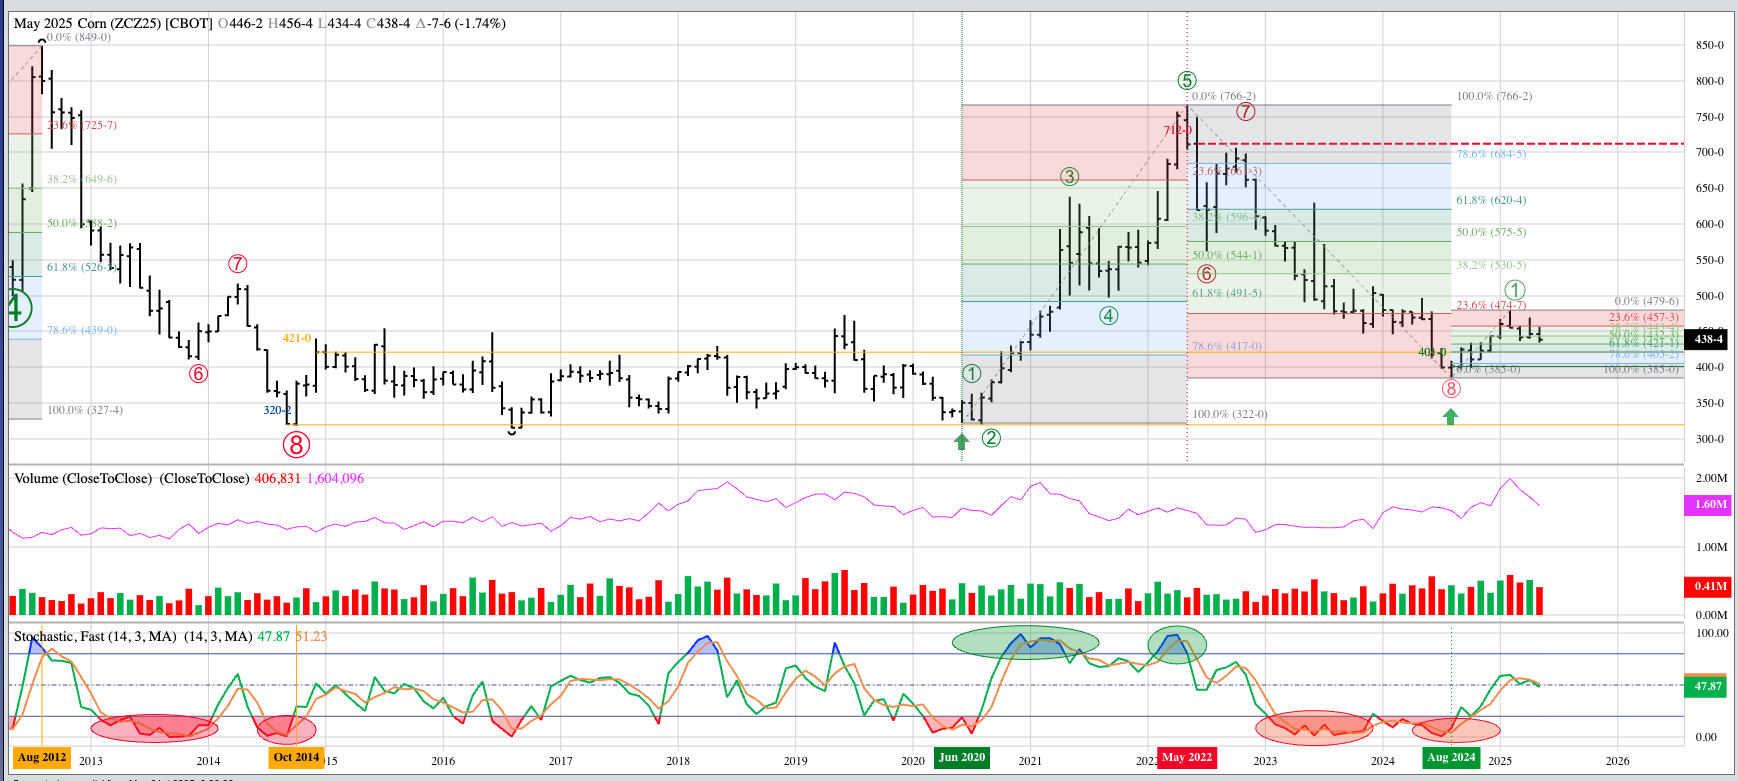
December Corn: There is a lot going on with the long-term continuous monthly chart for Dec Corn futures only. It’s likely Dec25 established the high-end of a potential major (long-term) sideways range back in February at $4.7975, similar to what occurred during the winter of 2014-2015. Recall this sideways pattern would last through the fall of 2020. If Dec corn is in a new major sideways trend with a high-end near $4.80, the low end would be the August 2024 low of $3.8550. The range back in 2014 to 2020 was from the low near $3.20 (September and October 2014) through the highs near $4.20.
Theoretical Positions:
- Hedgers:
- See Weekly Analysis: Grains (both Futures and Cash)
- Investors:
- Long Dec25 futures from $4.2650 were rolled to Dec26 futures at 2.0 cents carry on Friday, January 31
- Dec25 could’ve been sold at roughly $4.6025
- a gain of approximately 21.5 cents
- in addition to the gain of about 12.0 cents on the previous Dec24 long futures position
- a gain of approximately 21.5 cents
- Dec26 could’ve been bought at roughly $4.6225
- Dec25 could’ve been sold at roughly $4.6025
- Long Dec25 futures from $4.2650 were rolled to Dec26 futures at 2.0 cents carry on Friday, January 31
- The bottom line is long-term Investors will want to still be long Dec corn based on the bullish spike reversal at the end of August on the continuous monthly chart confirming the end of the previous long-term downtrend from May 2022 (See Monthly Analysis). At the end of April the investment position would be approximately:
- Short Dec25 near $4.93
- Dec25 closed April at $4.3850
- Long Dec26 near $4.6225
- Dec26 closed April at $4.6050
- Short Dec25 near $4.93
Teucrium Corn Fund (CORN) may have slipped into a major sideways trend. CORN closed at $18.12, down $0.62 for the month. Theoretical Positions: CORN could’ve been bought near the August 2024 settlement of $17.70. Additional longs could be established on buy stops above the previous 4-month high of $18.85 during January. If so, then the average position would be near $18.28. Sell stops would be below the major low of $17.02 from August 2024 for now.
November Soybeans: The continuous monthly chart for November soybeans continues to show a major sideways trend. Theoretical Positions: Traders would’ve gotten out of short November 2024 futures positions before the contract moved into delivery at the end of October.
The Teucrium Soybean Fund (SOYB) remains in a major 5-wave uptrend, with the fund completing a bullish outside month during April. Theoretical Positions: Investors would’ve bought near the December settlement of $21.48 with sell stops below the December low of $20.20. Some may be adding long positions near the April settlement of $21.47, again with sell stops below the December 2024 low.
The Teucrium Wheat Fund (WEAT) extended its major downtrend to a low of $4.33 during May before closing at $4.53. Theoretical Positions: Investors were likely stopped out as WEAT during March as it took out the previous low of $4.64 from January 2025.


