
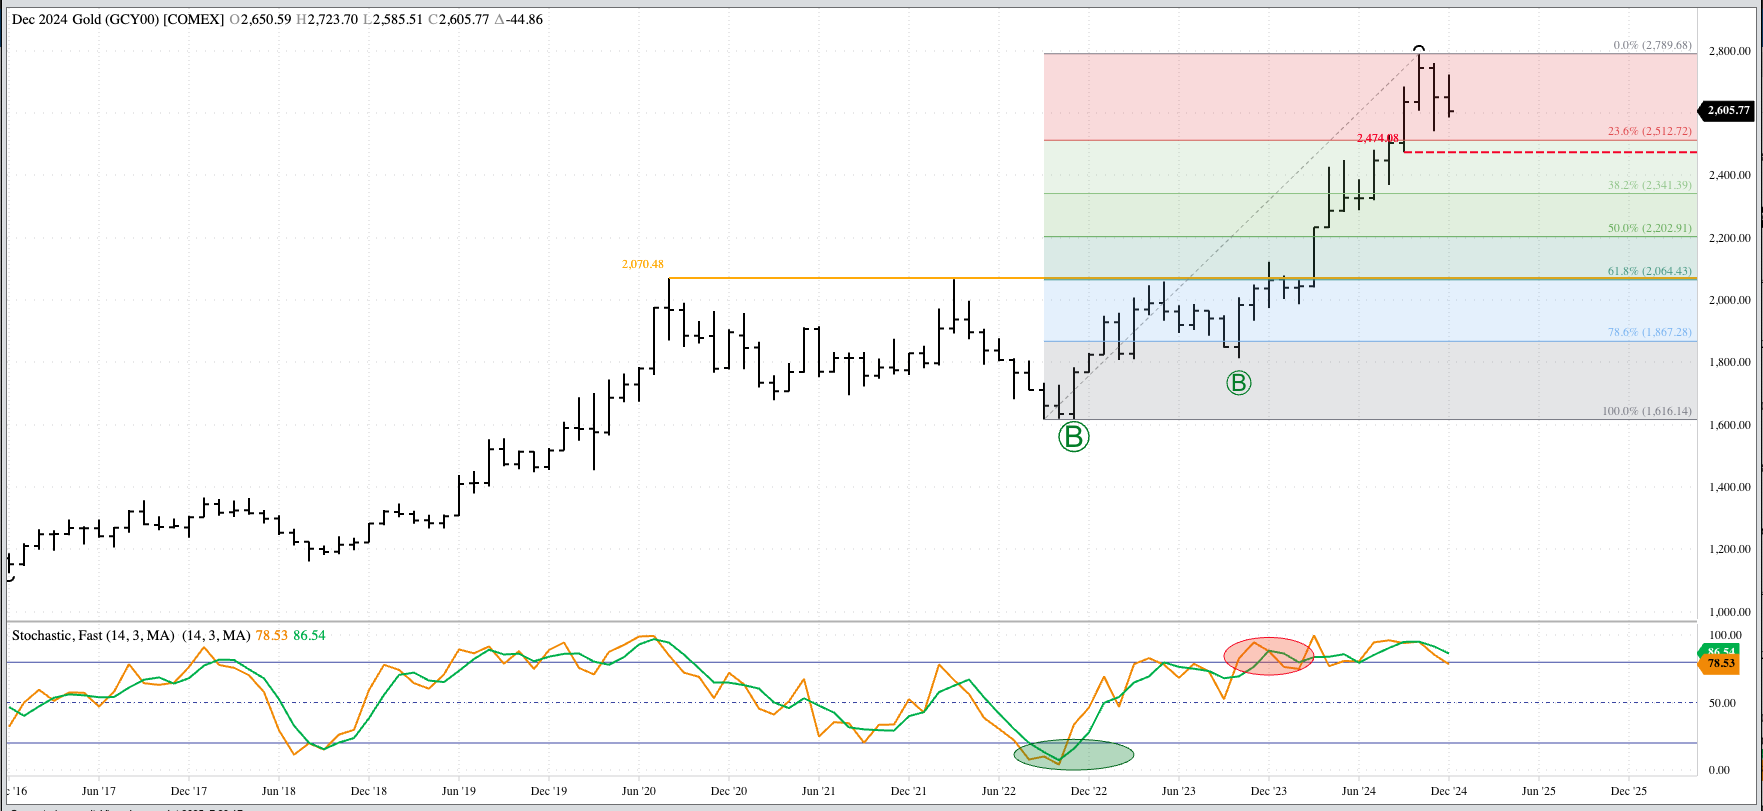


Gold (Cash Index): The cash index (GCY00) looks to be in a major (long-term) sideways trend between its previous 4-month low of $2,474.08 (September 2024) and 4-month high of $2,789.68 (October 2024). Monthly stochastics have established a series of bearish crossovers above the overbought level of 80% indicating the major trend could turn down over the coming months. For now, there is now clear trend. Theoretical Positions: It’s possible investment traders bought near the October 2023 close of $1,983.91 as previous short positions were stopped out. Sell stops would be placed below the previous 4-month low of $2,474.08 (September 2024).
Silver (Cash Index): The cash index (SIY00) remains in a major uptrend, despite the lower December settlement. The index finished the month at $28.9709, down $1.6491 after hitting a low of $28.7926. As with the gold index, silver has not completed a major bearish reversal as of the end of December. Theoretical Positions: Traders might’ve gone long as a new 4-month high ($25.7691) was posted during April. If still holding longs, the previous 4-month low is down at $27.7553 (September 2024).
Copper (Cash Index): The index still looks to be in a major 3-wave downtrend. If so, it would be expected to take out the Wave A (first wave) low of $3.9280 from August 2024. Theoretical Positions: It’s possible traders are staying on the sidelines for now. If short, as part of the major 3-wave downtrend discussion, buy stops would be above the Wave B (second wave) high of $4.5930 from October 2024.


