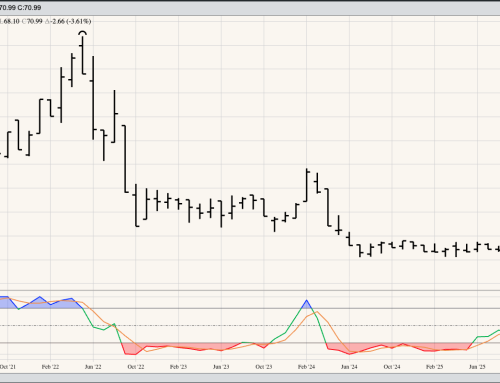
Soybean Cash Index: The Soybean Price Index (ISY00, national average cash price) extended the major (long-term) uptrend confirmed with the bullish spike reversal completed during October. Theoretical Positions: Remaining cash bushels from the 2023 harvest could be held. End-users could cover long-term needs during November. Traders could be long the market from near the October settlement of $12.3756 with sell stops below the October low of $11.8872.
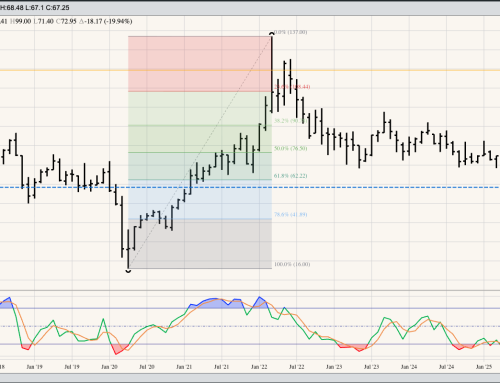
November Soybeans: The November 2023 contract went off the board and was replaced on the continuous November monthly chart with the 2024 issue. Nov24 closed the month at $12.94. The long-term chart still shows consolidation within the major uptrend established with the completion of a bullish 2-month reversal at the end of June. Theoretical Positions: Given 2024-2025 futures spreads remain bullish, there is likely few sales on the books versus the Nov24 contract. Sell stops could be placed below the previous 4-month low of $12.5050 (October 2023, the Nov23 contract).
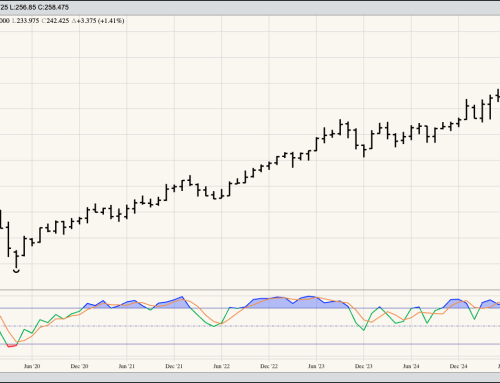
The Teucrium Soybean Fund (SOYB) monthly chart remains a mess. The bottom line is it looks like the fund is still in a major uptrend following a bullish 2-month reversal completed during June. Theoretical Positions: Investors might’ve gone long at the June close of $27.32. If so, technically, sell stops would be below the previous 4-month low of $26.59 from October 2023.