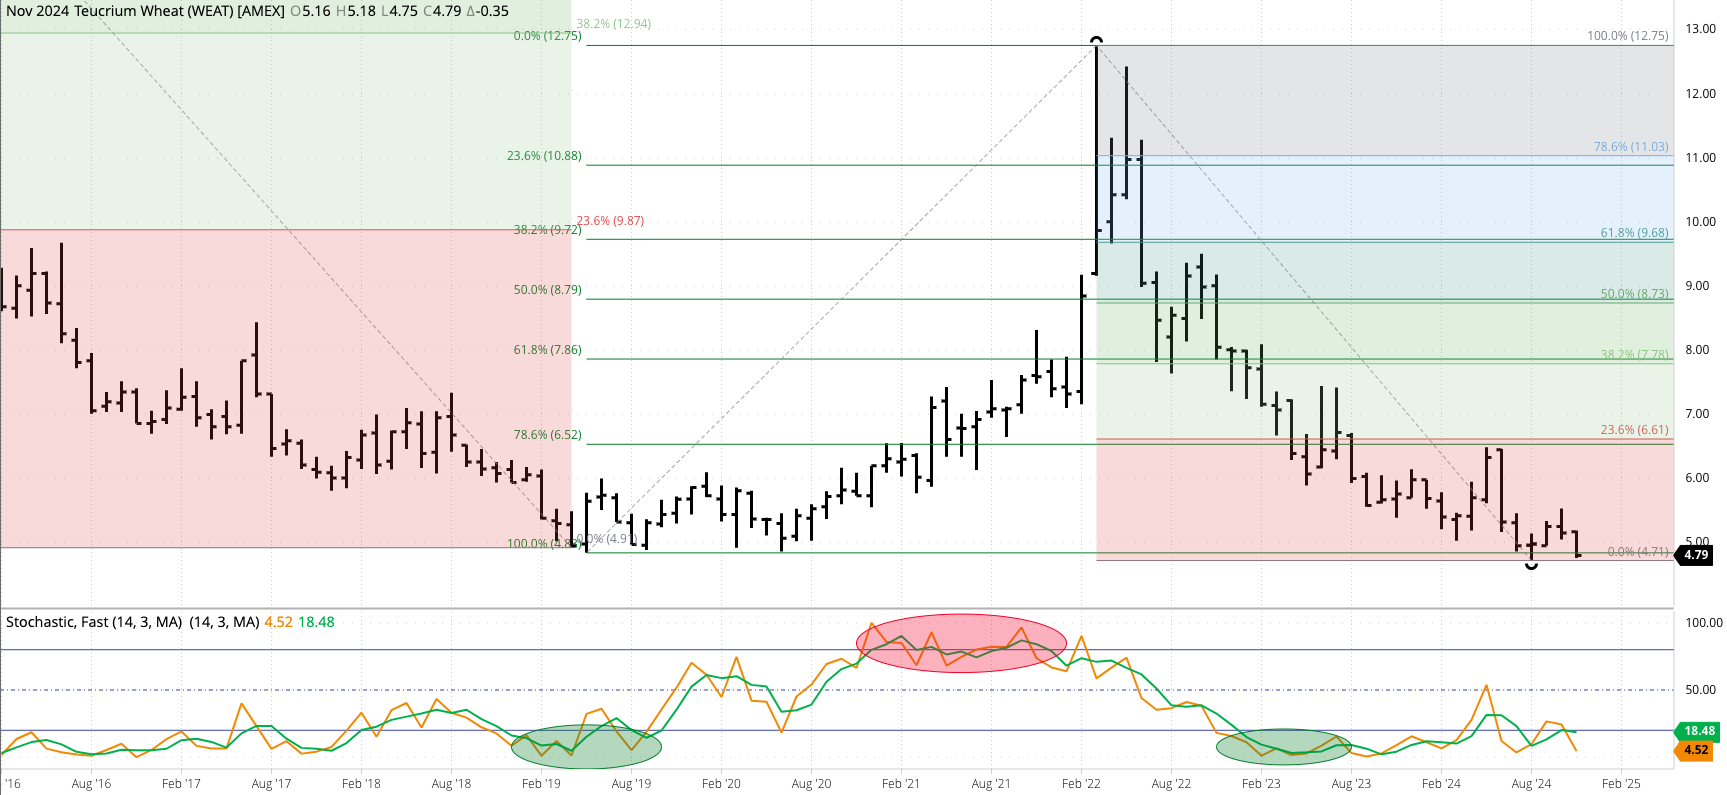


The Teucrium Wheat Fund (WEAT) still looks to be in a major (long-term) uptrend, though this analysis changes if we look at monthly closes only. While WEAT did not take out its previous monthly low of $4.71 (August 2024), with November’s low coming in at $4.75, the fund did post a new lifetime low monthly close of $4.79. This isn’t bullish, particularly if we apply the Wilhelmi Element: The only price that matters is the close. Theoretical Positions: Investors went long near the August settlement of $4.97 with sell stops below the August low of $4.71.
The SRW Wheat Price Index (IWY00) is in a major sideways trend. Support is at the low monthly close of $4.6065 from September 2023. Additionally, the July 2024 monthly close was $4.6801. Theoretical Positions: Traders are likely on the sidelines at this time. Keep in mind the Krampus Countdown that tells us to not be long wheat in December.
The HRW Wheat Price Index (IHY00) is in a major downtrend, posting a new low monthly close of $4.7311 at the end of November. This was the lowest month-end mark since $4.4786 at the end of August 2020. If we apply simple economics to HRW wheat (market price equals the intersection of supply and demand lines) then market fundamentals are as bearish as they’ve been in over four years. I’ll talk more about this in Monthly Supply and Demand commentary. Theoretical Positions: Traders are likely on the sidelines, buying cash HRW only as needed.
The HRS Wheat Price Index (IPY00) is in a major sideways trend based on its monthly close-only chart. The index closed November at $5.5870, holding above its low of $5.3176 (July 2024) and below its recent high of $5.7230 (September 2024). Theoretical Positions: Based on the Krampus Countdown, traders have likely moved to the sidelines until the HRS index breaks out one way or the other.