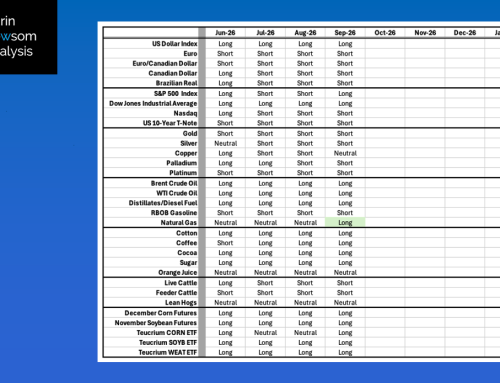
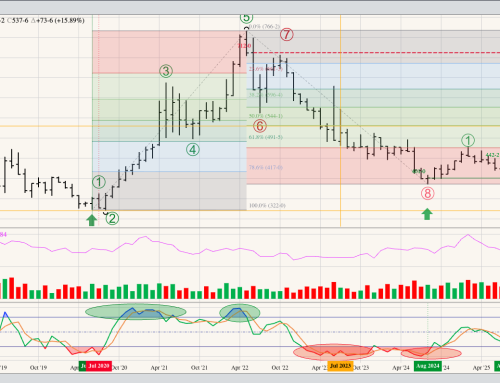
Side Note: For the record, I’m in agreement with Warren Buffett’s thoughts on technical analysis, at least in the Energies sector. Buffett has said on the subject, “I realized that technical analysis didn’t work when I turned the chart upside down and didn’t get a different answer.” To emphasize this point, the market making the most sense, from a technical point of view, is Natural Gas (aka the Widow Maker). That tells us all we need to know.
Brent crude (QA) remains in a major (long-term) sideways trend. Theoretical Positions: While most traders are likely on the sidelines, some short positions might’ve been established on the move to a new 4-month low during August. If so, this puts the position at roughly $76.74. Buy stops would be above the previous 4-month high of $82.40 (August 2024).
WTI crude oil (CL) remains in a major sideways trend. Theoretical Positions: Traders are likely on the sidelines at this time with no reason to be long or short.
Distillates (HO, heating oil, diesel fuel, jet fuel, etc.): I’m not sure what to call distillates trend, though a lower monthly close 10 out of the past 11 months certainly fits the definition of a downtrend. Additionally, the spot-month contract posted a new low of $2.0431 during September. Theoretical Positions: Traders have likely moved to the sidelines at this point. If not, they could be short from the initial new 4-month low near $2.6959 (December 2023). If so, buy stops would be above the previous 4-month high of $2.4668 (August 2024).
RBOB gasoline (RB) remains in a major sideways-to-down trend, holding above its September low of $1.8545 during November. Theoretical Positions: Traders have likely moved to the sidelines at this time.
Natural gas (NG) looks to be in a major uptrend. The spot-month contract took out the previous high of $3.159 (June 2024) during November on its way to a mark of $3.563 before closing at $3.431, up $0.724 for the month. The next upside target is the high of $3.643 from October 2023. Theoretical Positions: Traders might’ve gone long on the bullish breakout above $2.168 during May, the high from February 2024. Additional long positions may have been established above the May high of $2.924 during June. Additional longs may have been added near the August close of $2.127 based on the spot-month contract completing a bullish spike reversal, indicating a Wave 2 low. If so, then the average long position would be roughly $2.406 with sell stops below the previous 4-month low of $1.875 (August 2024).