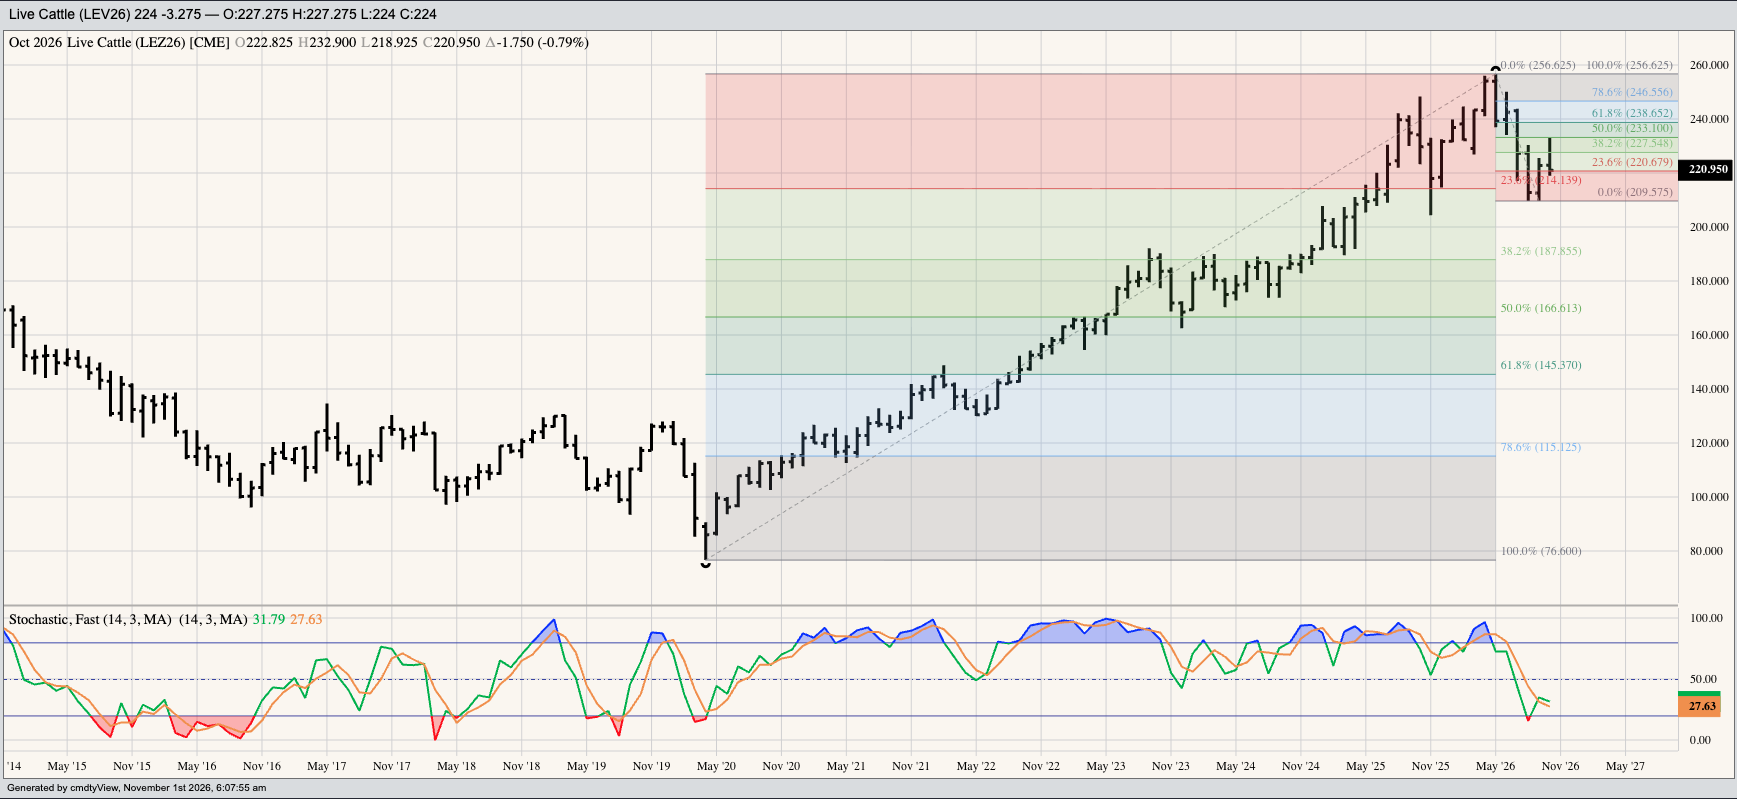


I’ve never liked using continuous monthly charts for the livestock markets given the different approach to analysis of futures spreads. However, it’s what we have at this time so I’ll make the best of it.
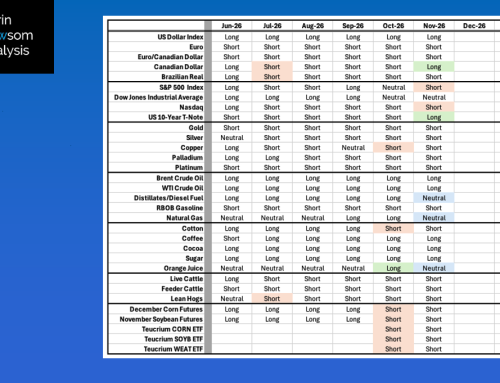
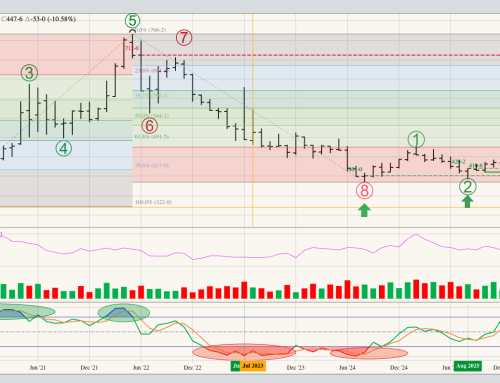
Live Cattle (Nearby futures): The December contract posted a high of $232.90 during October before selling off to close at $220.95, down $1.75 for the month. This completed a bearish spike reversal, what could be viewed as a Wave B (second wave) peak of the major (long-term) 3-wave downtrend. If so, the market would be expected to take about the Wave A (first wave) low of $209.525 from August. The downtrend began with the bearish key reversal during May 2026. Theoretical Positions: Investors long the market (futures, ETFs, etc.) based on continued bullish real fundamentals could’ve liquidated those positions and gone short near the May settlement of $239.00.
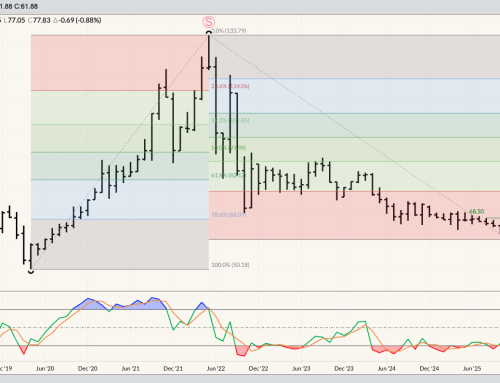
Feeder Cattle (Nearby futures): Theoretical Positions: Investors might’ve gone short futures near the May settlement of $348.425 based on the monthly bearish outside range. The January futures contract closed October at $331.775, down $2.525 for the month.
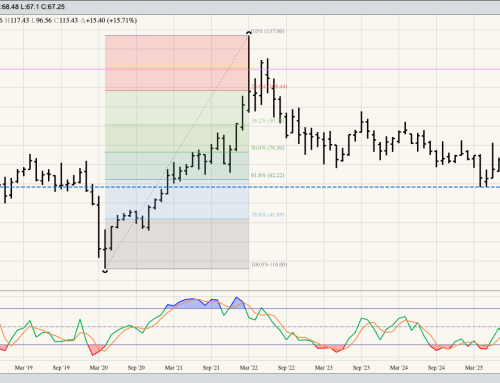
Lean Hogs (Nearby futures): While the market looks to have broken down during September, much of this is due to the roll from October to December futures on the continuous monthly chart with the spread at $9.30. This was in line with the previous 5-year average weekly close for the last week of September of $9.825. However, December extended the market’s major downtrend to a low of $58.20 during October before closing at $58.875, down $10.55 (15.2%) for the month. Much of this is due to the collapse in the US pork cutout market (slide 4), the CME Index calculated on Friday, October 30 at $72.89. This was the lowest daily calculation since December 30, 2020. Theoretical Positions: Long-term investors are likely on the sidelines or short the market. Monthly stochastics remain below the oversold level of 20%.