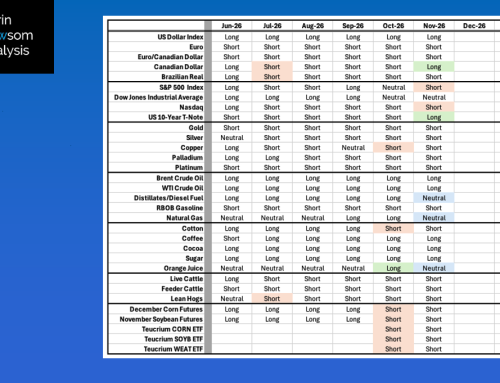
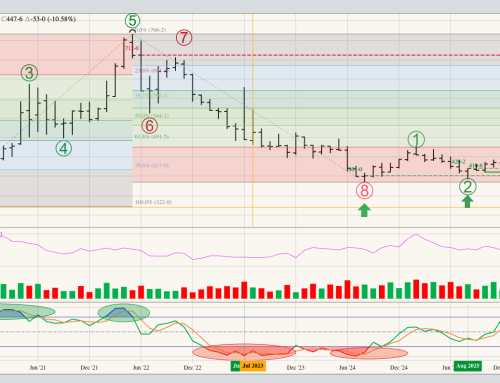
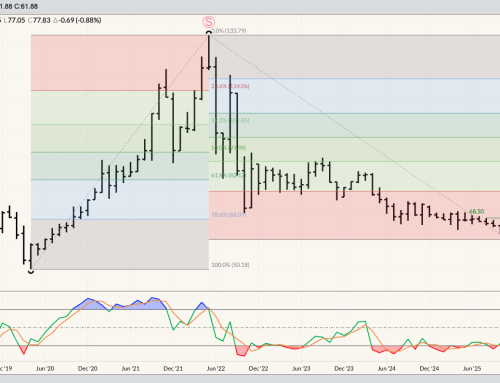
As usual, I don’t know how much we can read into technical analysis of the Energies sector at this time. Much could depend on the outcome of US mid-term elections on Tuesday, November 3. That being said, this is what I see on long-term monthly charts, from a technical point of view.
Brent crude (QA): Theoretical Positions: It’s possible investors went long the market during January or February on bullish technical breakouts. The market’s forward curve remains in backwardation telling us long-term fundamentals are bullish. The market completed another bullish outside range during July. The spot-month contract extended the rally to a high of $117.43 during October before closing at $113.43, up $15.40 (15.71%) for the month.
WTI crude oil (CL): It’s possible investors went long the market during January or February on bullish technical breakouts. The market’s forward curve remains in backwardation telling us long-term fundamentals are bullish. The market completed another bullish spike reversal during July. The spot-month contract rallied during October before closing at $104.12, up $13.70 (15.15%) for the month.
Distillates (HO, heating oil, diesel fuel, jet fuel, etc.): Theoretical Positions: Long-term investors and hedgers may have gone long during February, or covered cash needs, when the spot-month contract moved above the previous high of $2.74 from June 2025. The market’s forward curve remains in backwardation telling us long-term fundamentals are bullish.
RBOB gasoline (RB): Theoretical Positions: Investors long the market near the January 2026 settlement of $1.9422 may have liquidated those positions at May settlement of $3.0344. New short positions may have been established at the same price.
Natural Gas (NG): Theoretical Positions: Investors are likely on the sidelines, despite the market being long-term oversold.