Looking back at February, I question the accuracy of this key fundamental read. We saw extraordinary noncommercial buying over the course of the month, some of it generated by not necessarily the Truth Social media posts, similar to what we saw during October and November 2025. Our other reads of national average basis and futures spreads did not change as much as the Cash Indexes. My conclusion, taking all factors into account, is that US Grains supply and demand did not change as much this past month and quarter as the Indexes are indicating.
=======================================
The Law of Supply and Demand: Market Price is the point where the quantity demanded equals quantities available creating a market equilibrium. If we consider the three variables in the equation (Market Price = Supply, Demand) the only one known is Market Price. Therefore, a study of Market Price is all that is needed to understand the relationship between the unknown variables of Supply and Demand. For Market Price I’m using National Cash Indexes for the 5 major grain markets.
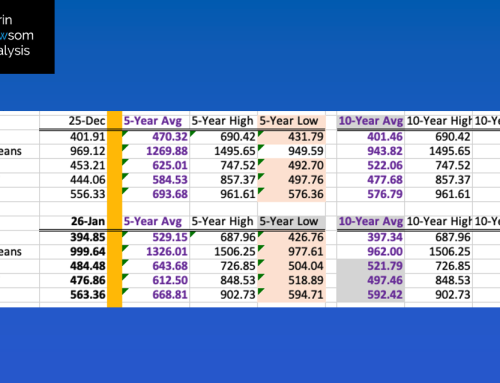
CORN: The National Corn Index was priced at $4.0774 at the end of February, as compared to end of January figure of $3.9485. The previous 5-year end of February low price was $3.9971 from 2024 with the 2025 price at $4.2708. Late January saw noncommercial traders reportedly holding a net-short futures position of 51,700 contracts, with covering continuing through late February resulting in a net-long of 8,830 contracts, a switch of 60,500 contracts. While not a huge figure, it was enough to rally the May futures contract 24.0 cents through the close on Friday, February 27. National average basis held steady at about 41.0 cents under May futures from the last weekly close of January through the last weekly close of February. Meanwhile the May-July spread covered 36% at the end February versus the 30% at the end of January. The bottom line for the corn market is supplies remain large in relation to demand.
As for quarterly supply and demand, the end of November 2025 price was $4.02 indicating the US continued to use some of its supplies during Q2 – no surprise in that. The biggest change I see is in exports. At the end of November the weekly shipment pace projection for the 2025-2026 marketing year was 5.16 billion bushels. This had dropped to 3.97 bb by late February.
SOYBEANS: The National Soybean Index was priced at $10.9420 at the end of February, as compared to end of January figure of $9.9964. The previous 5-year end of February low price was $9.5228 from 2025. It is the soybean market where we see the largest ripple effect of misleading social media posts. Not only were we told about “deals” between the US and China, there were also numerous promises of “bigly” domestic crush demand. A look at the monthly close-only chart for the Index (slide 3) and we see a similar pattern to last October and November when the same ideas were posted in an attempt to sway off-year elections. Note the Index then fell during December. Did US market fundamentals actually change during January and February? At the end of December, the March-May futures spread covered 42% calculated full commercial carry with the May-July covering 41%. At the end of February the same two spreads were covering 48% and 43%. The bottom line for the soybean market is it is not as bullish as it looks, but we’ll see what the spring quarter (March through May) brings.
SRW WHEAT: The National SRW Wheat Index was priced at $5.3818 at the end of February, as compared to end of January figure of $4.8448. The previous 5-year end of February low price was $4.9145 from 2025. It’s here we see a potential skew from noncommercial short-covering as Watson moved from a net-short futures position of 93,730 contracts on January 20 to a net-short futures position of only 16,090 contracts as of February 24.
HRW WHEAT: The National HRW Wheat Index was priced at $5.0625 at the end of February, as compared to end of January figure of $4.7686. The previous 5-year end of February low price was $4.9679 from 2025. National average basis remains weak with the end of February calculation coming in at 74.25 cents under May futures as compared to the previous 5-year low weekly close for the first week of March at 72.5 cents under May.
HRS WHEAT: The National HRS Wheat Index was priced at $5.8635 at the end of February, as compared to end of January figure of $5.6336. The previous 5-year end of February low price was $5.5711 from 2025. The bottom line for the HRS wheat market is national average basis was neutral-to-bearish at the end of the winter quarter.