
I’ve changed my monthly discussion of real month-end fundamentals for the various grain markets. I’m simplifying the conversation by applying the Law of Supply and Demand: Market Price is the point where the quantity demanded equals quantities available creating a market equilibrium. My take on this Law is tweaked by looking at “available supplies” rather than “total supplies”, an important distinction in the Grains sector given supplies can be held off the market in on-farm or commercial storage. If we consider the three variables in the equation (Market Price = Supply, Demand) the only one known is Market Price. Therefore, a study of Market Price is all that is needed to understand the relationship between the unknown variables of Supply and Demand.
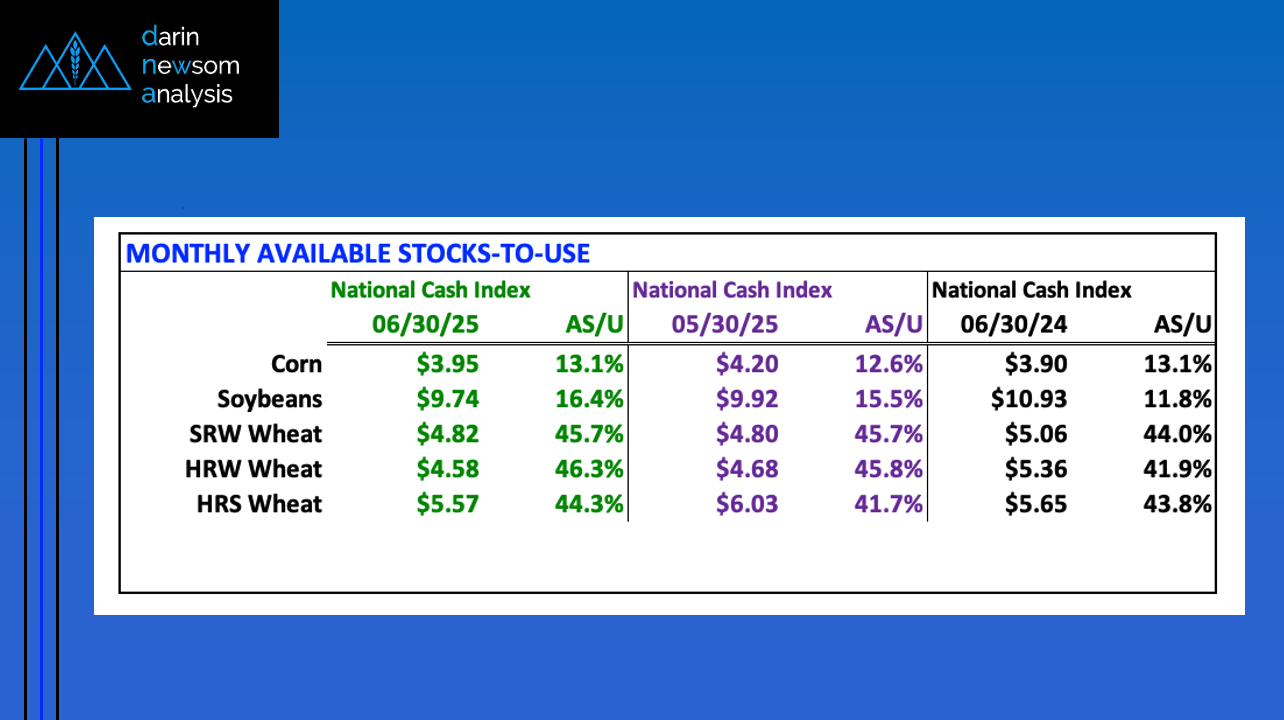
CORN: The National Corn Index (NCI) was calculated near $3.95 at the end of June, putting available stocks-to-use (as/u) at 13.1%. The end of May saw the NCI at $4.20 with as/u of 12.6% and June 2024 showed $3.90 and 13.1%. The end of June as/u came in above the previous 10-year average of 12.4% indicating old-crop supplies were larger than normal in relation to demand. As for new-crop, the September 2025-July 2026 forward curve closed June at a carry of 48.5 cents and covered 47% calculated full commercial carry and compared to the end of May’s settlement of 45.25 cents and 43.5%. The end of June 2024 saw that year’s Sept-July spread settle at 44.25 cents and 42% indicating this year’s commercial outlook is more bearish than last year’s.
SOYBEANS: The National Soybean Index (NSI) was calculated near $9.74 at the end of June, putting available stocks-to-use (as/u) at 16.4%. The end of May saw the NSI at $9.92 with as/u of 15.5% and June 2024 showed $10.93 and 11.8%. The end of June as/u came in above the previous 10-year average of 14.7% indicating old-crop supplies were larger than normal in relation to demand. As for new-crop, the November 2025-July 2026 forward curve closed June at a carry of 47.75 cents and covered 44% calculated full commercial carry and compared to the end of May’s settlement of 40.0 cents and 37%. The end of June 2024 saw that year’s Nov-July spread settle at 34.0 cents and 28.5% indicating this year’s commercial outlook is less bullish than last year’s.
SRW WHEAT: The National SRW Wheat Index (SWI) was calculated near $4.82 at the end of June, putting available stocks-to-use (as/u) at 45.7%. The end of May saw the SWI at $4.80 with as/u of 45.7% and June 2024 showed $5.06 and 44.0%. The end of June as/u came in above the previous 10-year average of 41.9% indicating new-crop supplies were larger than normal in relation to demand. The previous 10-year end of June high settlement was 51% from 2016. The September-December futures spread covered 66% calculated full commercial carry while the Dec-March covered 58%. At the end of May, these spreads covered 69% and 60% respectively indicating the market’s commercial outlook has stabilized.
HRW WHEAT: The National HRW Wheat Index (HWI) was calculated near $4.58 at the end of June, putting available stocks-to-use (as/u) at 46.3%. The end of May saw the HWI at $4.68 with as/u of 45.8% and June 2024 showed $5.36 and 41.9%. The end of June as/u came in above the previous 10-year average of 42.1% indicating new-crop supplies were larger than normal in relation to demand. The previous 10-year end of June high settlement was 54.6% from 2016. The September-December futures spread covered 71% calculated full commercial carry while the Dec-March covered 65%. At the end of May, these spreads covered 66% and 55% respectively indicating the market’s commercial outlook continued to grow more bearish.
HRS WHEAT: The National HRS Wheat Index (HSI) was calculated near $5.57 at the end of June, putting available stocks-to-use (as/u) at 44.3%. The end of May saw the HSI at $6.03 with as/u of 41.7% and June 2024 showing $5.65 and 43.8%. The end of June as/u came in above the previous 10-year average of 40.8% indicating new-crop supplies were larger than normal in relation to demand. The previous 10-year end of June high settlement was 51.0% from 2016. The bottom line is spring wheat fundamentals remained neutral at the end of June.