I’ve changed my monthly discussion of real month-end fundamentals for the various grain markets. I’m simplifying the conversation by applying the Law of Supply and Demand: Market Price is the point where the quantity demanded equals quantities available creating a market equilibrium. If we consider the three variables in the equation (Market Price = Supply, Demand) the only one known is Market Price. Therefore, a study of Market Price is all that is needed to understand the relationship between the unknown variables of Supply and Demand.
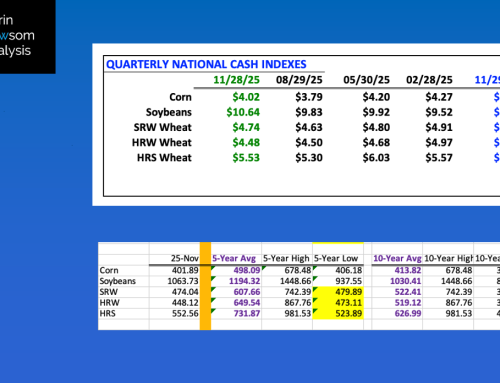
CORN: The National Corn Index (NCI) was calculated near $3.7325 at the end of September, as compared to end of August figure of $3.7925 and last September’s $3.9275. This was the lowest end of September Index price since 2020’s $3.5250 indicating more supplies on hand in relation to demand. The previous 5-year end of September average price was $4.7825 with the 10-year end of September average price at $4.03. The bottom line is that while demand remains solid for US corn, supplies are growing as well with the 2025 harvest in full swing.
SOYBEANS: The National Soybean Index (NSI) was calculated near $9.2025 at the end of September, as compared to end of August figure of $9.8275 and last September’s $9.94. This was the lowest end of September Index price since 2019’s $8.2475. The previous 5-year end of September average price was $11.3925 with the 10-year end of September average price at $10.1275. This confirms US soybean supplies were far outdistancing demand through the end of September.
SRW WHEAT: The National SRW Wheat Index (SWI) was calculated near $4.3775 at the end of September, as compared to end of August figure of $4.6250 and last September’s $5.0875. This was the lowest end of September Index price since 2017’s $4.03. The previous 5-year end of September average price was $6.1025 with the 10-year end of September average price at $5.1950. The US SRW wheat supply and demand situation was dramatically bearish at the end of September, a time of year when demand starts to gain on supplies.
HRW WHEAT: The National HRW Wheat Index (HWI) was calculated near $4.2159 at the end of September, as compared to end of August figure of $4.4975 and last September’s $5.2475. This was the lowest end of September Index price since 2019’s $3.8875. The previous 5-year end of September average price was $6.5350 with the 10-year end of September average price at $5.2375. At face value, the US HRW fundamental situation actually seems more bearish than SRW.
HRS WHEAT: The National HRS Wheat Index (HSI) was calculated near $5.0950 at the end of September, as compared to end of August figure of $5.3025 and last September’s $5.7225. This was the lowest end of September Index price since 2020’s $5.0775. The previous 5-year end of September average price was $7.1050 with the 10-year end of September average price at $6.0725. While not as bearish as winter markets, US spring wheat was still fundamentally bearish at the end of September.