I’ve changed my monthly discussion of real month-end fundamentals for the various grain markets. I’m simplifying the conversation by applying the Law of Supply and Demand: Market Price is the point where the quantity demanded equals quantities available creating a market equilibrium. My take on this Law is tweaked by looking at “available supplies” rather than “total supplies”, an important distinction in the Grains sector given supplies can be held off the market in on-farm or commercial storage. If we consider the three variables in the equation (Market Price = Supply, Demand) the only one known is Market Price. Therefore, a study of Market Price is all that is needed to understand the relationship between the unknown variables of Supply and Demand.
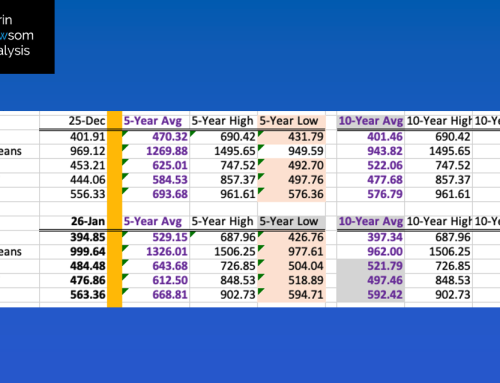
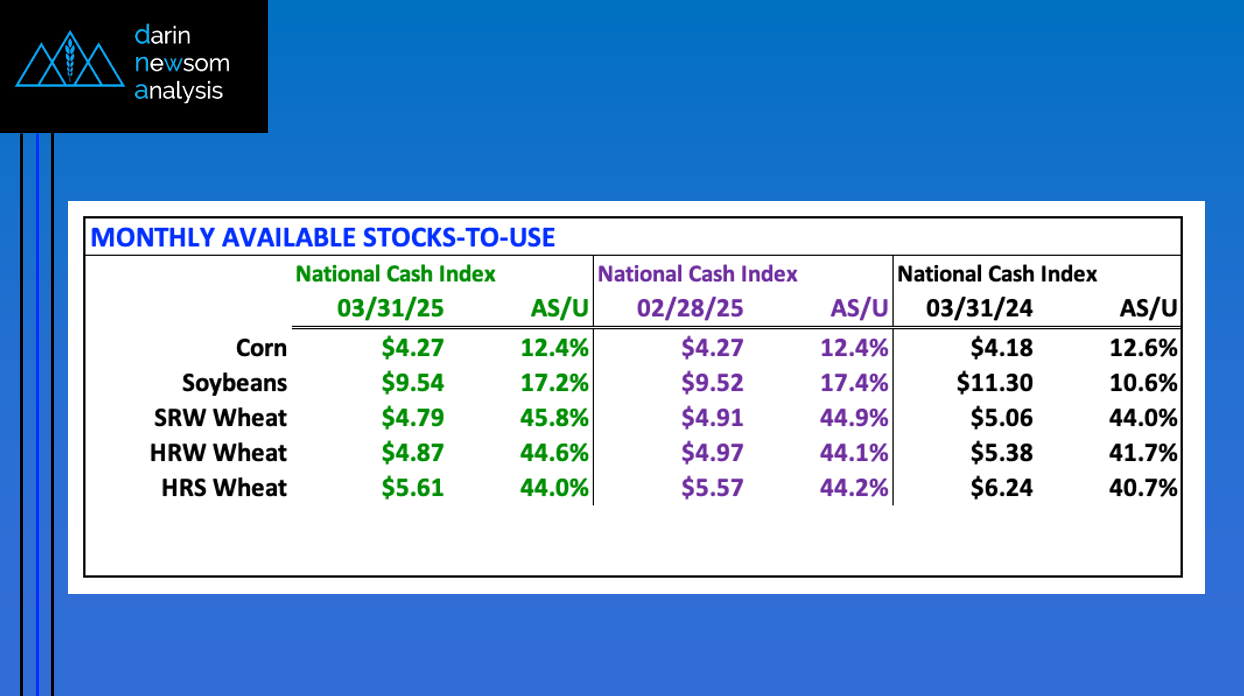
CORN: The National Corn Index (NCI) was calculated near $4.27 at the end of March, putting available stocks-to-use (as/u) at 12.4%. Both were generally unchanged from end of February with March 2024 showing $4.18 and 12.6%. The US corn supply and demand has stabilized, not overly surprising given the flow of supplies moving from on-farm storage to off-farm slows this time of year. Seasonally, Q3 of the marketing year (March through May) sees the National Corn Index post a solid rally as attention turns to planting season of the next crop. The seasonal rally by the NCI indicates available supplies tend to tighten in relation to demand.
SOYBEANS: The National Soybean Index (NSI) was calculated near $9.54 at the end of March, putting available stocks-to-use (as/u) at 17.2%. The end of February saw the NSI at $9.52 with as/u of 17.4% and March 2024 showed $11.30 and 10.6%. The US supply and demand situation didn’t change much last month. Longer-term, the end of March as/u figure was the largest since 2020’s 23.3%, and well above the previous 10-year average March figure of 15.0%. The bottom line is the US has ample supplies of soybeans in relation to demand heading into planting season of the next crop.
SRW WHEAT: The National SRW Wheat Index (SWI) was calculated near $4.79 at the end of March, putting available stocks-to-use (as/u) at 45.8%. The end of February saw the SWI at $4.91 with as/u of 44.9% and March 2024 showed $5.06 and 44.0%. The March as/u number of 44.9% was the largest March figure going back through 2020. The bottom line is the US SRW market is fundamentally bearish. And not just by a little.
HRW WHEAT: The National HRW Wheat Index (HWI) was calculated near $4.87 at the end of March, putting available stocks-to-use (as/u) at 44.6%. The end of February saw the HWI at $4.97 with as/u of 44.1% and March 2024 showed $5.38 and 41.7%. The March HRW as/u number of 44.1% was the second largest March figure going back through 2020, training only that year’s figure of 45.6%. The bottom line is the US HRW market remains fundamentally bearish heading toward the 2025 crop.
HRS WHEAT: The National HRS Wheat Index (HSI) was calculated near $5.61 at the end of March, putting available stocks-to-use (as/u) at 44.0%. The end of February saw the HWI at $5.57 with as/u of 44.2% and March 2024 showing $6.24 and 40.7%. The US HRS wheat supply and demand situation continued to tighten during March, albeit slightly. We need to keep in mind what I call the Wheat Reality*, not just in HRS but all wheat classes. Given this, the bottom line is HRS wheat remains fundamentally bearish.
*The wheat reality tells us, “One bushel of wheat left over is too many.