


The bottom-line fundamental number is stocks-to-use. I’ve long said stocks-to-use is the Readers’ Digest version of supply and demand, in that this one number can tell us the bullishness, bearishness, or neutrality of a market’s fundamentals. I’ve also argued endlessly over the years with economists, my point being there should be a strong positive correlation between stocks-to-use and cash price. Given this premise, I’ve developed my system between the two for the five major markets (corn, soybeans, and three major wheat classes) with the r-squared[I]for all near 100%. Using this system I can pull data any day of the month, but by using the end of month number it gives us a picture of the available stocks-to-use (as/u) situation at month-end, a system that should smooth out the wide changes seen at the end of a marketing year. It also puts a spotlight on what I call the Marketing Year Misdirection, meaning supply and demand is a constant flow rather than a hard line drawn between old-crop and new-crop.
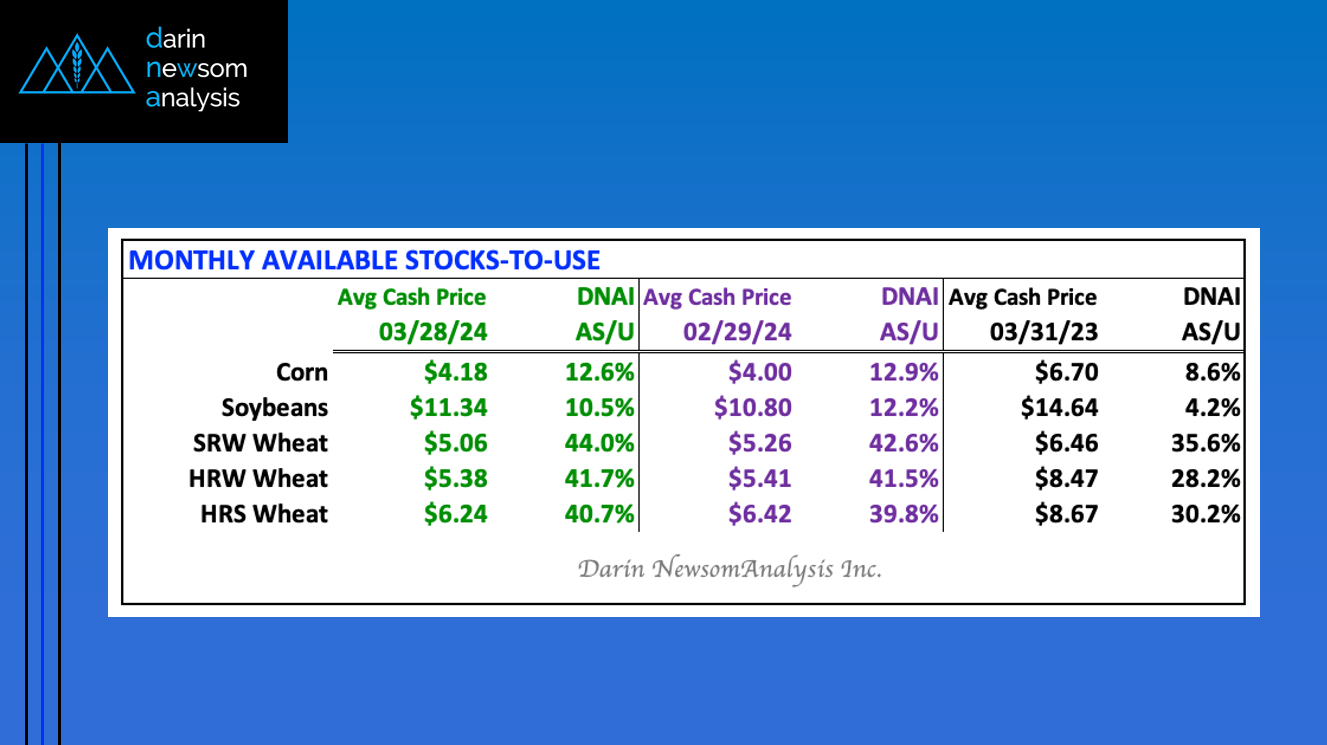
CORN: The national average cash price for corn was calculated at roughly $4.18 on March 28, 2024, a price that correlates to an end of month available stocks-to-use (as/u) of 12.6%. The end of February showed $4.00 and 12.9% with March 2023 coming in at $6.70 and 8.6%. A couple things to note: First, a stronger cash corn market during March is seasonal as export demand flips from soybeans to corn at the end of February (roughly). Additionally, demand from both feed and ethanol picks up as well. The month of March saw national average basis firm from 33.25 cents under May futures to 23.75 cents under May. All while the futures contract closed 12.5 cents higher for the month.
SOYBEANS: The national average cash price for soybeans was calculated at $11.34 on March 28, 2024, a price that correlates to an end of month available stocks-to-use (as/u) of 10.5%. The end of February showed $10.80 and 12.2% with March 2023 coming in at $14.64 and 4.2%. Despite the rally during March, I still see the downside target for the National Soybean Index, based on monthly closes only, near $10.25. As for the March rally, for now I’ll chalk it up to fund short covering more than a change in fundamentals. Weekly CFTC Commitments of Traders reports (legacy, futures only) showed funds moved from a net-short of 191,232 contracts the week of February 26 to 153,714 contracts the week ending March 26.
SRW WHEAT: The national average cash price for SRW wheat was calculated at $5.06 on March 28, 2024, a price that correlates to an end of month available stocks-to-use (as/u) of 44%. The end of February showed $5.26 and 42.6% with March 2023 coming in at $6.46 and 35.6%. The bottom line is SRW wheat fundamentals continue to grow more bearish.
HRW WHEAT: The national average cash price for HRW wheat was calculated at $5.38 on March 28, 2024, a price that correlates to an end of month available stocks-to-use (as/u) of 41.7%. The end of February showed $5.41 and 41.5% with March 2023 coming in at $8.43 and 28.2%. Similar to SRW, HRW fundamentals are consistently growing more bearish.
HRS WHEAT: The national average cash price for HRS wheat was calculated at $6.24 on March 28, 2024, a price that correlates to an end of month available stocks-to-use (as/u) of 40.7%. The end of February showed $6.42 and 39.8% with March 2023 coming in at $8.67 and 30.2%. Completing the wheat trifecta, HRS continues to grow more fundamentally bearish as well.
[i] R-squared is defined as “a statistical measure of fit that indicates how much variation of a dependent variable is explained by the independent variable in a regression model.” (Investopedia). In my world, it is how closely related two (or more) variables are, in this case national average cash price and stocks-to-use.


