


The bottom-line fundamental number is stocks-to-use. I’ve long said stocks-to-use is the Readers’ Digest version of supply and demand, in that this one number can tell us the bullishness, bearishness, or neutrality of a market’s fundamentals. I’ve also argued endlessly over the years with economists, my point being there should be a strong positive correlation between stocks-to-use and national average cash price (National Price Indexes). Given this premise, I’ve developed my system between the two for the five major markets (corn, soybeans, and three major wheat classes) with the r-squared[I]for all near 100%. Using this system I can pull data any day of the month, but by using the end of month number it gives us a picture of the available stocks-to-use (as/u) situation at month-end, a system that should smooth out the wide changes seen at the end of a marketing year. It also puts a spotlight on what I call the Marketing Year Misdirection, meaning supply and demand is a constant flow rather than a hard line drawn between old-crop and new-crop.
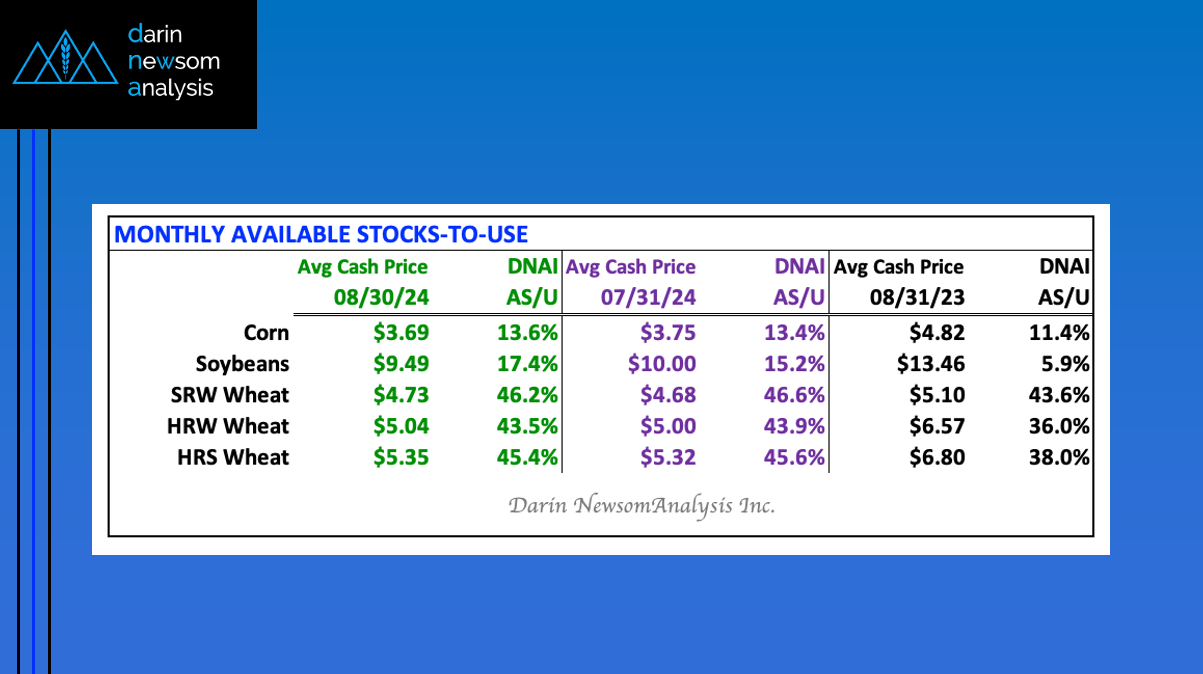
CORN: The National Corn Index (NCI) was calculated at $3.69 on August 30, 2024, a price that correlates to an end of month available stocks-to-use (as/u) of 13.6%. The end of July 2024 showed $3.75 and 13.4% with August 2023 coming in at $4.82 and 11.4%. This was the largest end of the month as/u since 13.8% (September 2020) and the largest end of the marketing year as/u since August of that same year (14.4%). It’s interesting to note by the end of August 2021, corn’s as/u had dropped to 10.0% indicating demand increased due to low price and ample supplies.
SOYBEAN: The National Soybean Index (NSI) was calculated at $9.49 on August 30, 2024, a price that correlates to an end of month available stocks-to-use (as/u) of 17.4%. The end of July 2024 showed $10.00 and 15.2% with August 2023 coming in at $13.46 and 5.9%. This was the largest end of the month end of the marketing year as/u since August 2020 at 19.0% (NSI = $9.01). By the ned of April 2021 the NSI had rallied to $15.41 with as/u falling to 3.4%, due to weather problems in Brazil (if I recall correctly).
SRW WHEAT: The National SRW Wheat Index (SWI) was calculated at $4.73 on August 30, 2024, a price that correlates to an end of month available stocks-to-use (as/u) of 46.2%. The end of July 2024 showed $4.68 and 46.6% with August 2023 coming in at $5.10 and 43.6%. The SWI continues to hold above its low monthly close of $4.61 from September 2023 with as/u that month at 47%. Regardless, the Wheat Reality tells us, “One bushel of wheat left over is too many”, and there is obviously more than one bushel of wheat available.
HRW WHEAT: The National HRW Wheat Index (HWI) was calculated at $5.04 on August 30, 2024, a price that correlates to an end of month available stocks-to-use (as/u) of 43.5%. The end of July 2024 showed $5.00 and 43.9% with August 2023 coming in at $6.57 and 36.0%. This was the largest end of August as/u since 2020 when the HWI was calculated at $4.48 and as/u was 46.8%.
HRS WHEAT: The National HRS Wheat Index (HSI) was calculated at $5.35 on August 30, 2024, a price that correlates to an end of month available stocks-to-use (as/u) of 45.4%. The end of July 2024 showed $5.32 and 45.6% with August 2023 coming in at $6.80 and 38.0%. With the 2024 spring wheat harvest reportedly beyond the midway point, this was the largest end of August as/u since 2020’s 47.5% (HSI = $4.94).
[i] R-squared is defined as “a statistical measure of fit that indicates how much variation of a dependent variable is explained by the independent variable in a regression model.” (Investopedia). In my world, it is how closely related two (or more) variables are, in this case national average cash price and stocks-to-use.


