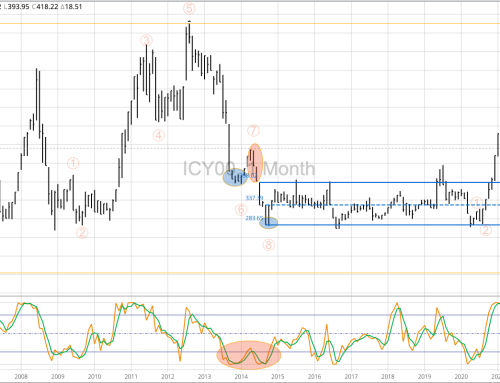
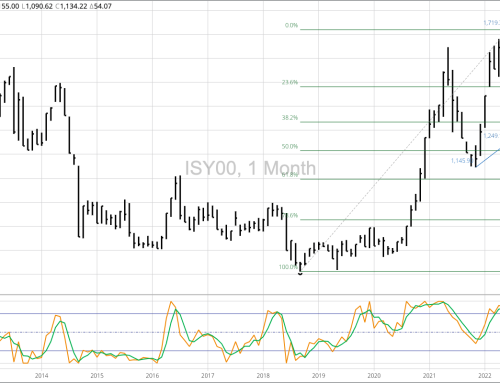
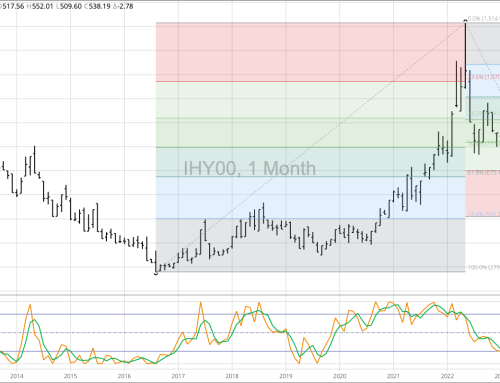
The continuous monthly chart for November soybeans looks similar to what we discussed in cash soybeans, with the ongoing rally looking like an extended Wave 5 of a 5-wave uptrend pattern. The 2021 issue posted a high of $12.5275 during February, the highest mark for a November contract since May 2014. The next upside target is near $13.00, a price marking the 50% retracement level of the previous major (long-term) downtrend from $17.89 (September 2012) through the low of $8.1225 (September 2018). However, monthly stochasitcs are already well above the overbought level of 80%, setting the stage for a potential bearish crossover. the previous bearish signal occurred at the end of April 2018 with a bullish crossover below the oversold level of 20% at the end of October 2018. Given new-crop soybeans bullish fundamentals, with the November 2021-to-September 2022 forward curve inverted, the November contract could continue to find plenty of buying interest until these same fundamentals change. Given the wave pattern, though, we will need to keep an eye out for a Wave 5 peak.


