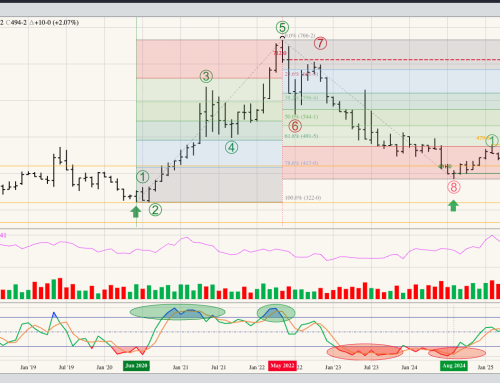
A look at the continuous monthly chart for November soybean futures only shows a similar pattern to cash soybeans, an ongoing 3-wave major (long-term) downtrend. However, confirmation of this trend did not occur until the November 2021 issue took out the previous 4-month low of $12.4050 during October 2021. The 2022 issue has rallied during December and January, a move that could be considered Wave B (second wave) of the 3-wave pattern. But it’s here a familiar argument can be made: If November soybeans posted a new 4-month high, which it did by taking out $13.08 during December, wouldn’t it be considered a new uptrend? I can’t say no, except for the technical idea the previous downtrend doesn’t look to have ended. That being said, I’ll be looking for a clear major bearish reversal pattern on the monthly and/or weekly chart before I get interested in selling again.