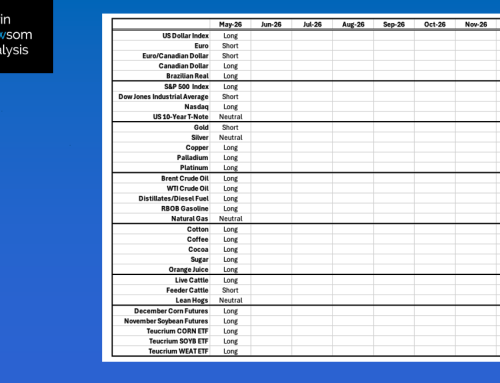
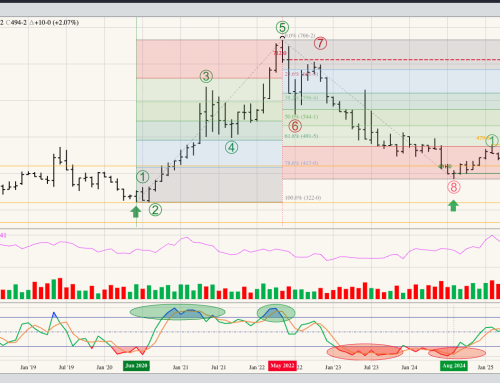
The cmdty National Soybean Price Index (NSPI, weighted national average cash price) remains in a major (long-term) 3-wave downtrend. The ongoing rally off the November low of $11.4157 can be considered Wave B (second wave) of the 3-wave pattern. If we employ the Benjamin Franklin Fish Similarity (like guests and fish, a market moving three days/week/months against its trend starts to stink), February would be the third higher month against the major downtrend. Given this, we need to keep a close eye on the NSPI’s weekly chart for a bearish reversal pattern confirming the secondary (intermediate-term) trend has turned down. Weekly stochastics are sharply overbought, though the NSPI is showing no sign of slowing its secondary uptrend.