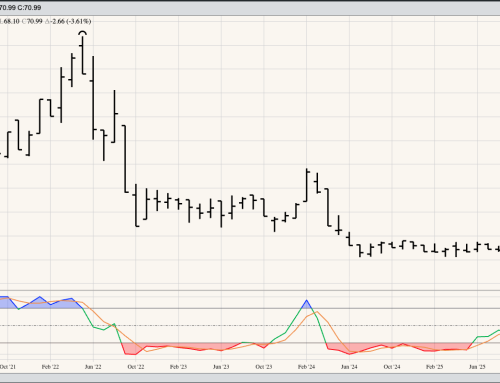
A cash index I follow for corn (one with more history than the cmdty National Corn Price Index I generally talk about) extended its major (long-term) uptrend during March, closing at its high near $5.54. Note this was above the next target near $5.49, a price marking the 50% retracement level of the previous major downtrend from $8.26 (August 2012) through the low of $2.73 (September 2016). The next upside target is the 61.8% retracement mark near $6.15. While corn’s fundamentals remain bullish, as indicated by both national average basis and the strong inverse in the May-July futures spread, there is some concern cash corn is becoming top heavy, possibly nearing a tipping point. Note monthly stochastics are hovering just short of 100%, indicating a sharply overbought situation that has been in place since last December. How will we know when the rally in the cash market is coming to an end? The canary in the coal mine, or the best read on a bubble about to burst, has always been basis. If we see national average basis start to falter then we can assume the cash market is approaching its tipping point.
Or in other words, as Newsom’s Market Rule #6 tells us: Fundamentals win in the end.