
My monthly analysis of the key grain and oilseed markets will focus on the cmdty National Price Indexes (weighted national average cash prices). Recall from numerous previous discussions I view these as the intrinsic value of the individual markets meaning long-term monthly charts give us a good read on outlook.
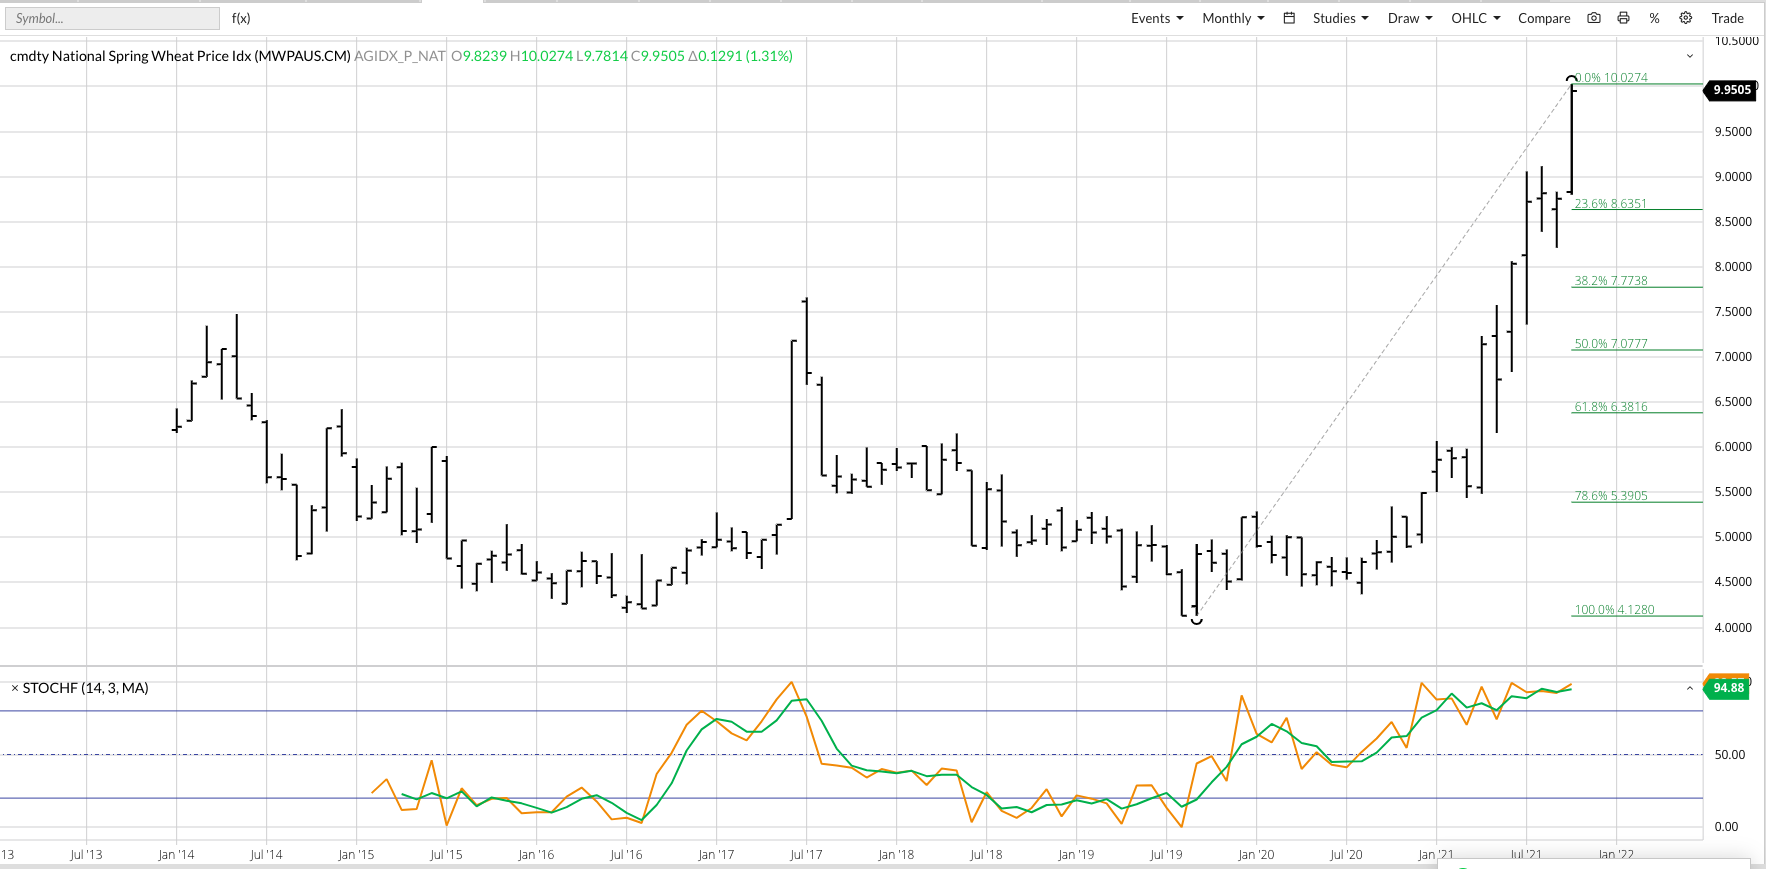
The last couple years have seen a number of markets post vertical rallies; a list that includes lumber, hogs, copper, crude oil, oats, and now spring wheat. The cmdty National HRS Wheat Price Index (HSPI) posted a high of $10.0274 during October, hitting its monthly high on Friday, October 29 and finishing the month just off the mark at $9.9505. Monthly stochastics show the HSPI to be sharply overbought, itself not a bearish signal dooming the major (long-term) uptrend to a quick end but rather an indicator we should continue to look for signs of a possible bearish turn. There are a couple areas of concern for spring wheat:
- National average basis weakened 14 consecutive days to close out the month, with the cmdty National HRS Basis Index finishing the month below the previous 5-year average.
- Some of this could be attributed to the high futures price
- But remains the first phase of Grains’ Golden Rule playing out, “First basis, then spreads, then futures.”
- Speaking of futures spreads, the inverse in the Dec-March posted a high of 24.5 cents on October 22 before weakening to 16.5 cents on October 27 and closing last week at 19.25 cents.
- Given what we’ve seen on the short-term daily chart, it would not be surprising to see the inverse start to weaken again this coming week.


