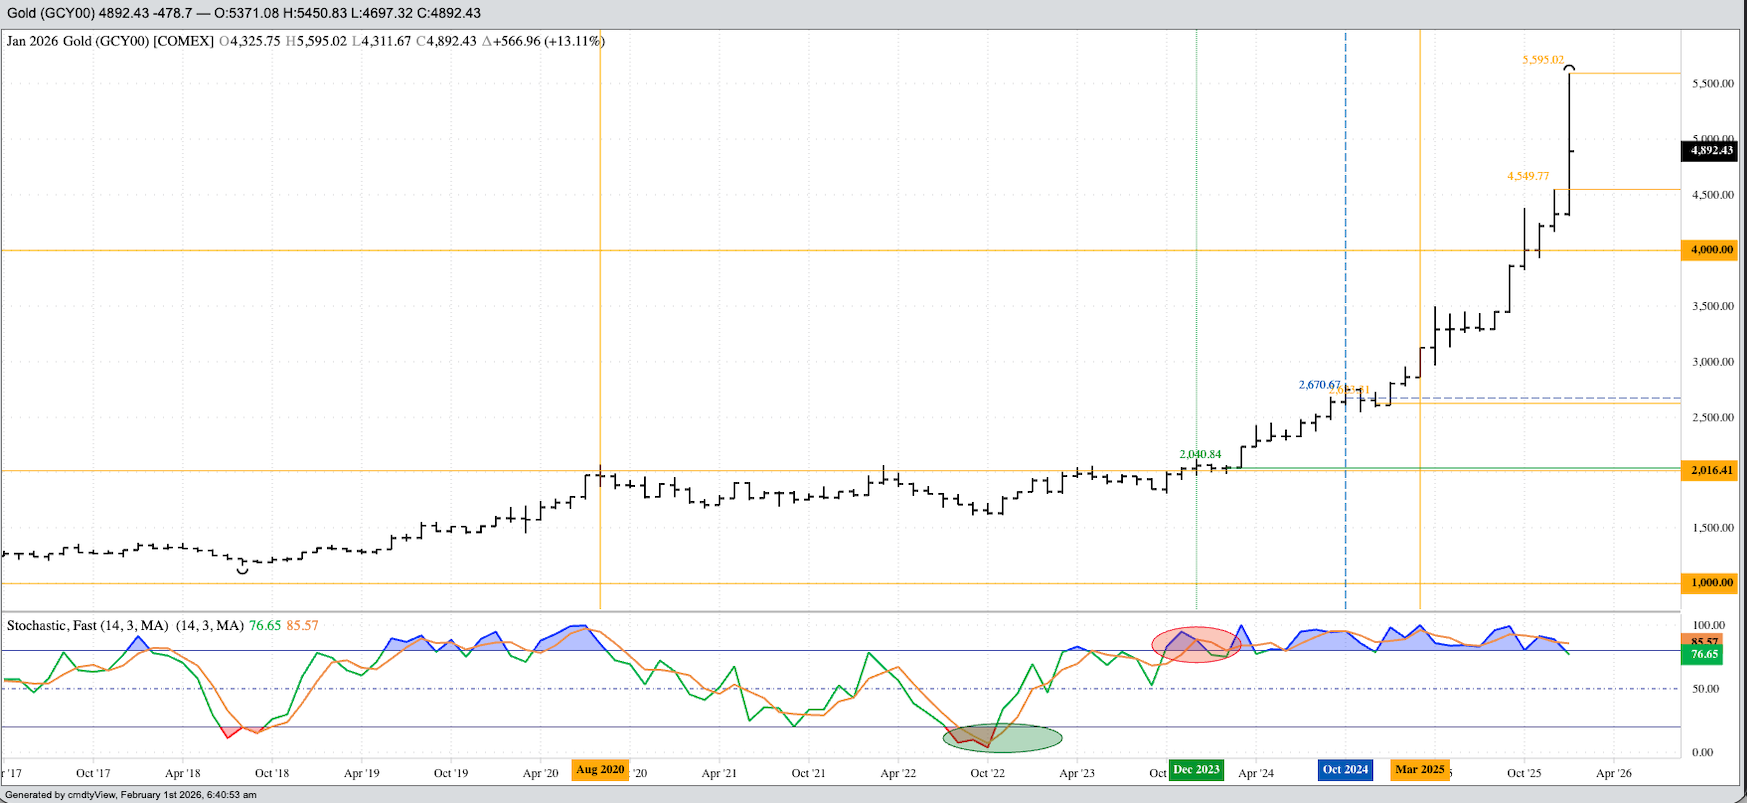


Gold (Cash Index): Despite the end of January’s extreme selloff, the Index remains in a major (long-term) uptrend. The Gold Index hit a high. of $5,595.02 before closing the month at $4,892.43, still up $566.96 (13.1%) from December’s settlement. Given the political and economic chaos created by the US president, the catalyst for the record rally, we have to expect this type of elevated volatility. Theoretical Positions: It’s possible investment traders bought near the October 2023 close of $1,983.91 as previous short positions were stopped out. There have been numerous buys, mostly on new 4-month highs, since the key bullish reversal completed during November 2022. The market is not a technical trade at this point but rather a fundamental safe-haven market against increased global uncertainty.
Silver (Cash Index): The Index extended its major uptrend to a high $121.6017 before melting down on Friday, January 30. Still, the Silver Index finished the month at $85.2914, up $13.8263 (19.4%) from the December settlement. My thoughts on silver haven’t changed: The market continues to show characteristics of both a short-supply (spike rally) and demand-driven (higher prices over time) market. For now I will hold to the idea the end of January saw a Vacuum Trade: the market simply ran out of buy orders at month end. But we need to keep a close eye on the Index in early February. Theoretical Positions: Investors have likely bought the market numerous times since the initial buy at the close of September 2022.
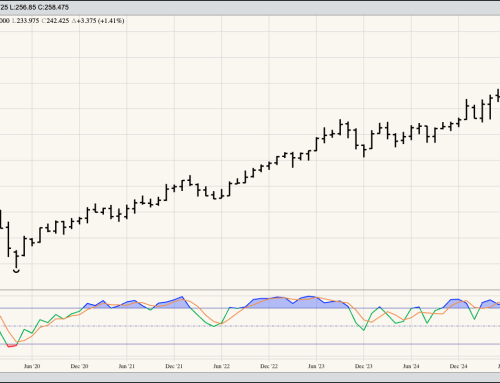
Copper (Cash Index): The copper Index extended the major uptrend on its monthly close-only chart, settling January at $5.8980. This was up 24.9 cents (4.4%) for the month. If we view Dr. Copper as an economic indicator, then the global economic situation would still be considered bullish. Theoretical Positions: Investors may have established long positions a number of times over the past few years.
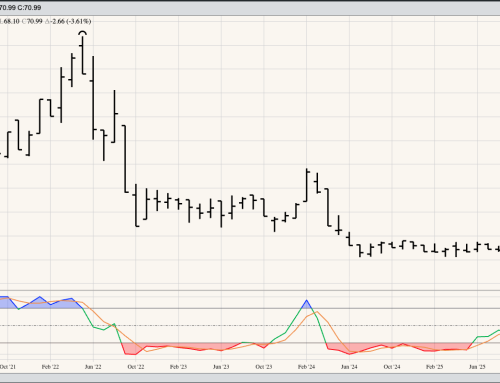
Palladium (Nearby futures): The spot-futures contract extended the market’s major uptrend on the monthly close-only chart, settling January at $1,688.30. This was up $59.10 (3.6%) for the month. Theoretical Positions: Investors may have established long positions a number of times since the May 2024 low monthly close of $899.20.
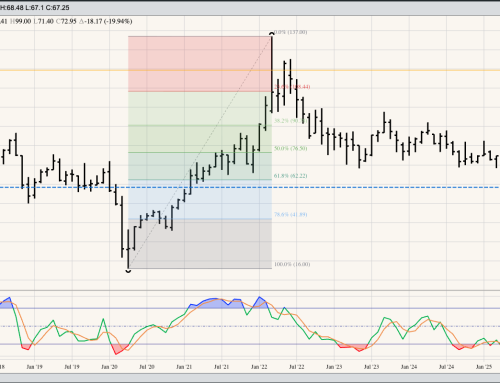
Platinum (Nearby futures): The spot-futures contract extended the market’s major uptrend on the monthly close-only chart, settling January at $2,102.80. This was up $68.30 (3.4%) for the month. Theoretical Positions: Investors may have established long positions a number of times since the June 2025 breakout monthly close of $1,334.00.