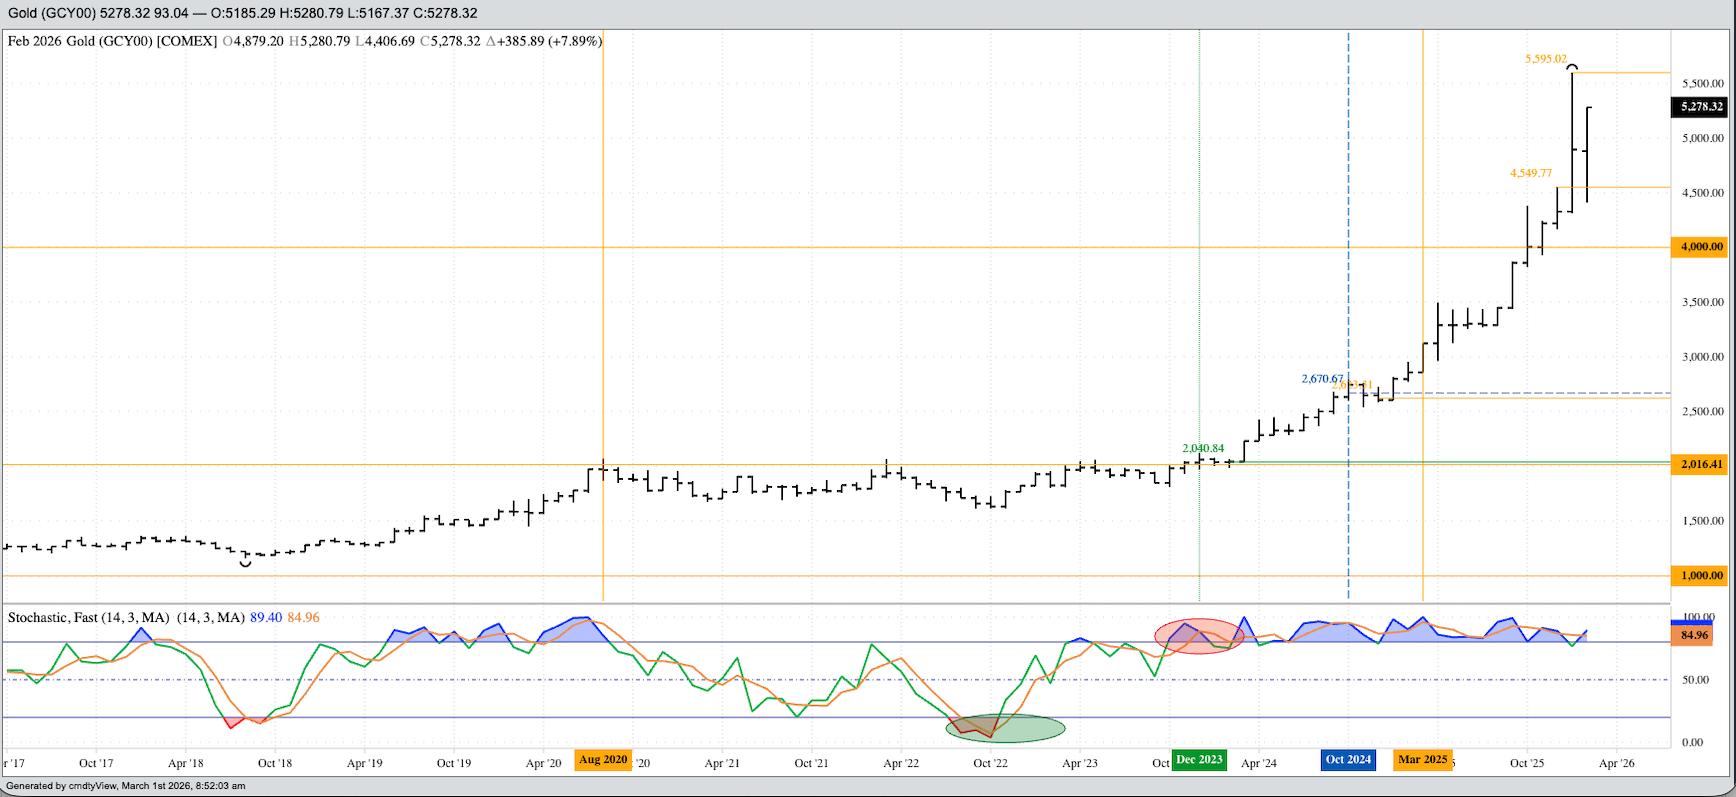


Gold (Cash Index): Gold’s Cash Index remains in a major (long-term) uptrend. Theoretical Positions: It’s possible investment traders bought near the October 2023 close of $1,983.91 as previous short positions were stopped out. There have been numerous buys, mostly on new 4-month highs, since the key bullish reversal completed during November 2022. The market is not a technical trade at this point but rather a fundamental safe-haven market against increased global uncertainty.
Silver (Cash Index): The Index remains in a major uptrend. My thoughts on silver haven’t changed: The market continues to show characteristics of both a short-supply (spike rally) and demand-driven (higher prices over time) market. Theoretical Positions: Investors have likely bought the market numerous times since the initial buy at the close of September 2022.
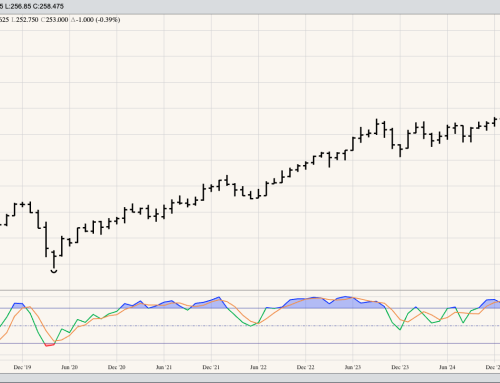
Copper (Cash Index): The copper Index extended the major uptrend on its monthly close-only chart, settling February at $5.9815. This was up 8.35 cents (1.4%) for the month. If we view Dr. Copper as an economic indicator, then the global economic situation would still be considered bullish. Theoretical Positions: Investors may have established long positions a number of times over the past few years.
Palladium (Nearby futures): The spot-futures contract extended the market’s major uptrend on the monthly close-only chart, settling February at $1,792.20. This was up $103.90 (6.2%) for the month. Theoretical Positions: Investors may have established long positions a number of times since the May 2024 low monthly close of $899.20.
Platinum (Nearby futures): The spot-futures contract extended the market’s major uptrend on the monthly close-only chart, settling February at $2,635.60. This was up $262.80 (12.5%) for the month. Theoretical Positions: Investors may have established long positions a number of times since the June 2025 breakout monthly close of $1,334.00.