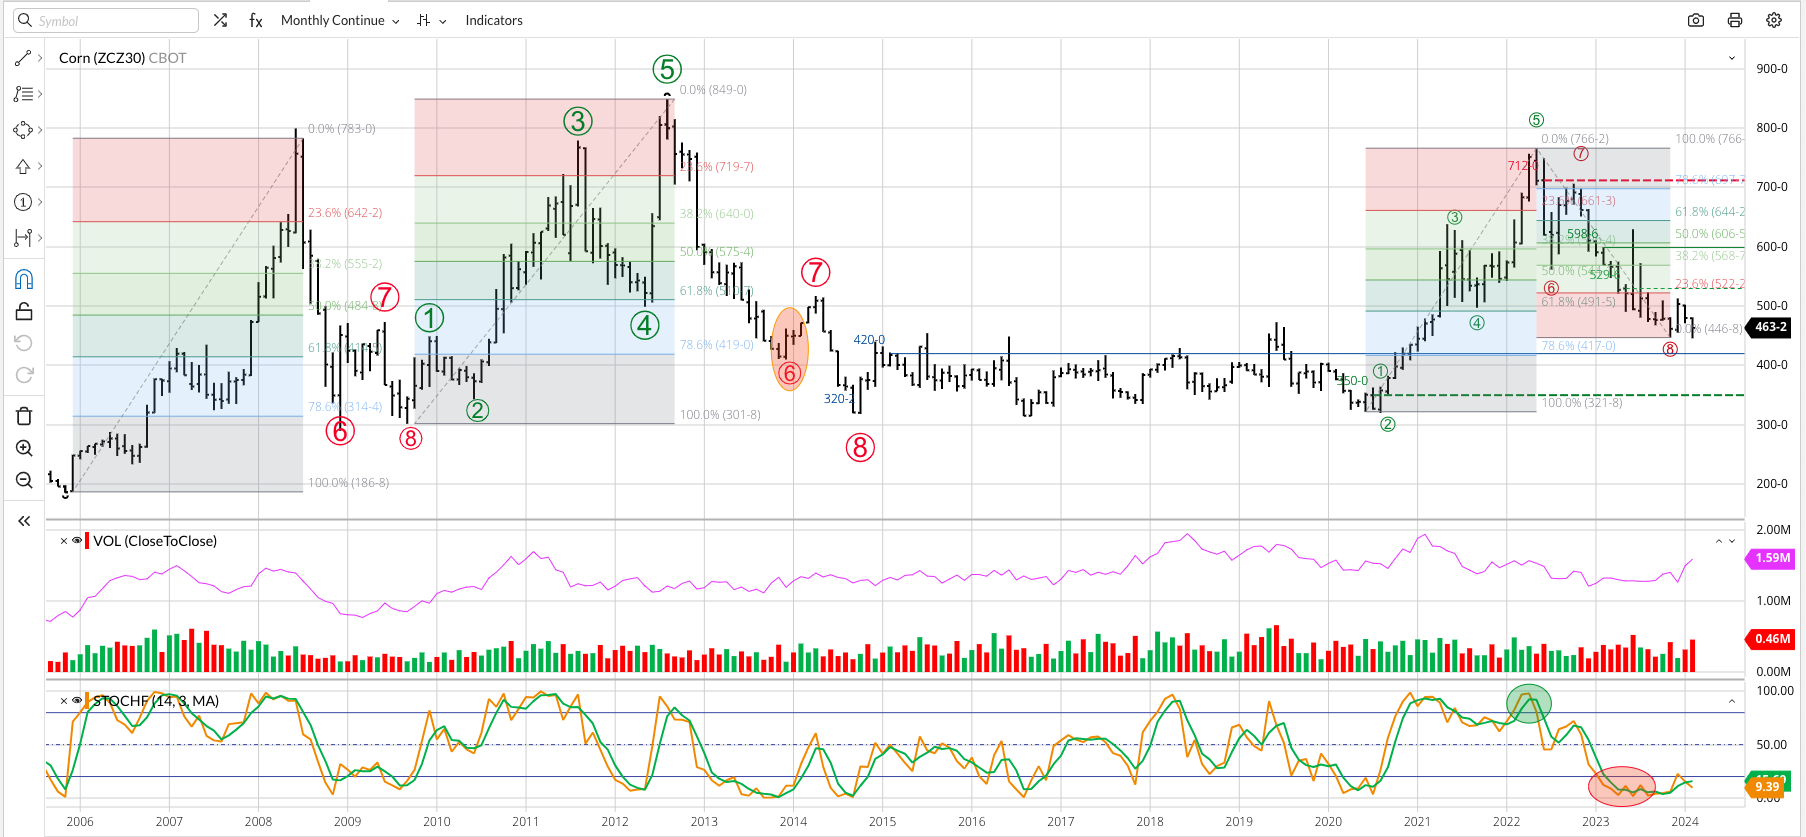


Corn Cash Index: The National Corn Price Index (NCI, national average cash price) extended its major (long-term) downtrend to a low of $3.8031 during February before closing at $3.9971, down 27.05 cents for the month. What jumps out to me is how corn’s characteristic Round Number Reliance came into play with both the monthly low and close. Also, the NCI dropped to a test of its previous sideways range of roughly $3.80 before rallying. Historically, $3.80 would be expected to hold selloffs, though this idea could be tested if the NCI continues to follow the path laid out from 2010 to 2014 (see Supply and Demand Commentary). Theoretical Positions:Continue to buy cash corn as needed only until a clear bullish reversal is completed.
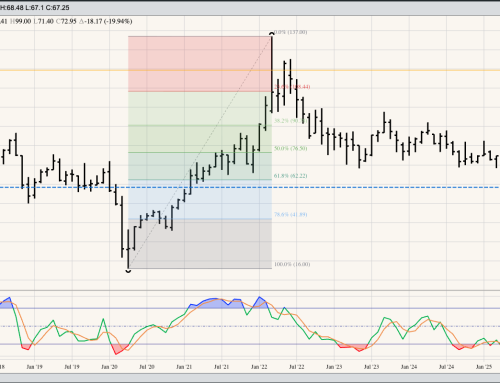
December Corn: Dec24 posted a new long-term low of $4.46 during February before closing at $4.6325, down 16.75 cents for the month. A look at the monthly chart shows the Dec14 contract rallied during the spring of that year before falling to a new low of $3.1825 during October. It’s interesting to note the 2014 issue closed February at $4.7150. Why the comparison back to 2014? I’ll talk about it in more detail in my Monthly Column.
Theoretical Positions:
- Hedgers:
- Dec24 and Dec25 hedges established during 2022 and 2023 continue to be held (see Weekly Analysis).
- Traders:
- Still holding short Dec24 futures after rolling from Dec23 at a strong carry during November 2023.
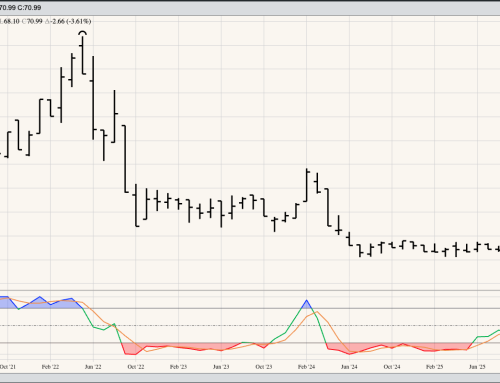
Teucrium Corn Fund (CORN) extended its major downtrend to a new low of $18.72 during February before closing at $19.49, down $1.04 for the month. Theoretical Positions: None at this time.