
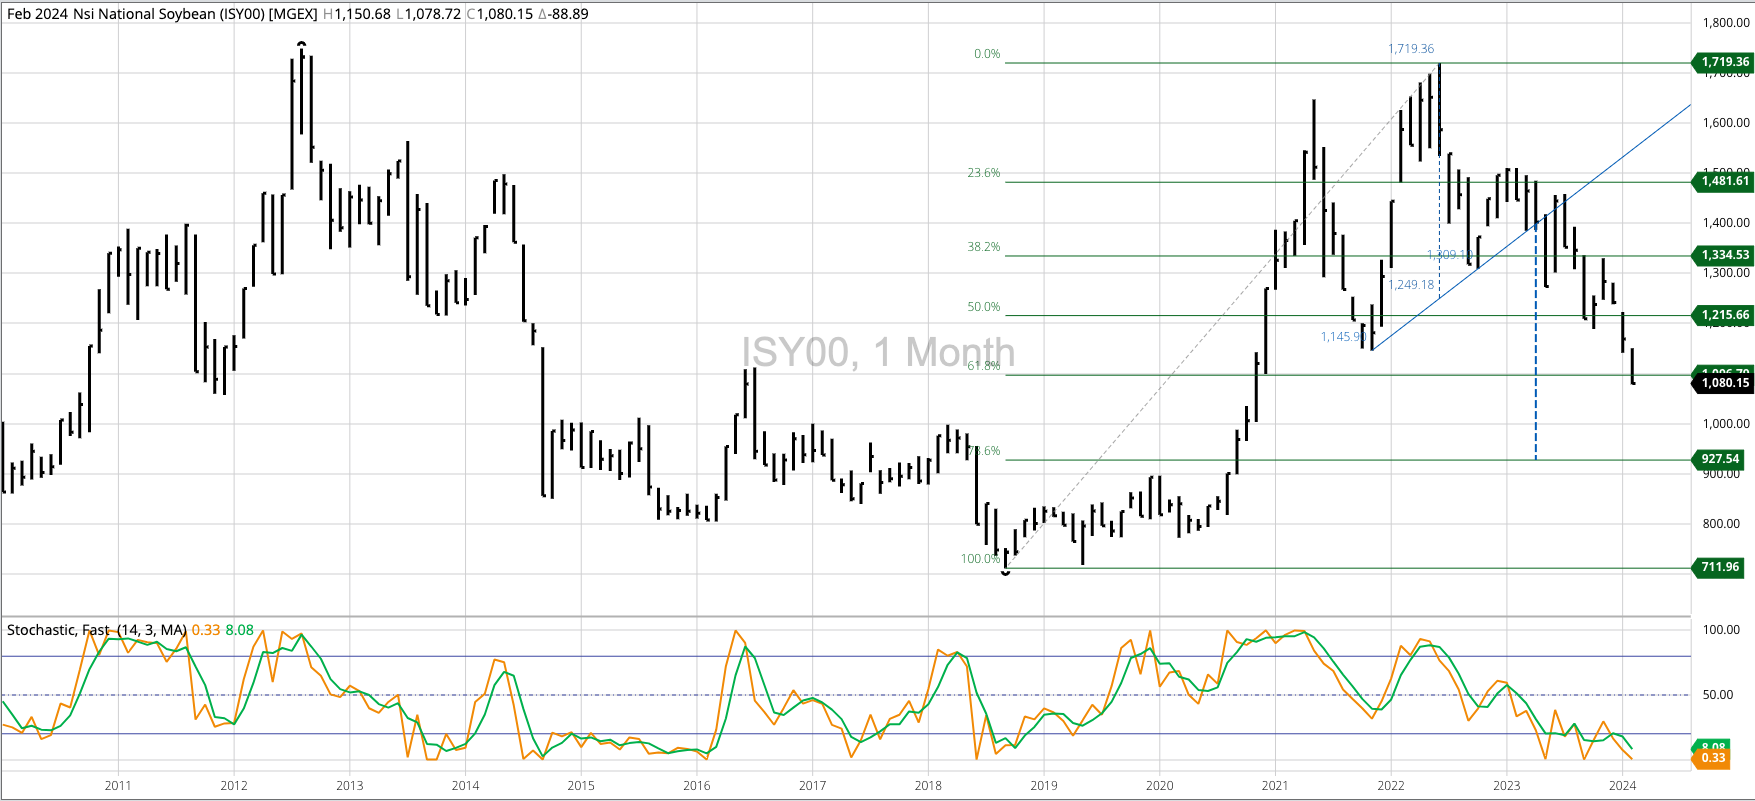


Soybean Cash Index: The Soybean Price Index (ISY00, national average cash price) extended its major (long-term) downtrend to a low of $10.7812 during February before closing the month at $10.8015. Based on the indexes long-term monthly close-only study, the downside target remains near $10.25. Theoretical Positions: Remaining cash bushels from the 2023 harvest would’ve been sold on sell stops below the October low of $11.8872. End users could continue to buy on an as-needed basis.
November Soybeans: The November 2024 contract extended its major downtrend to a low of $11.2275 during February before closing at $11.3325, down 66.5 cents for the month. The low took out the previous mark of $11.3050 from May 2023. With US producers expected to plant more soybean acres during the spring of 2024, Nov24 could continue to move lower. Theoretical Positions: Sell stops might’ve been triggered below the previous 4-month low of $12.5050 (October 2023, the Nov23 contract). Additional stops might’ve been triggered in late February with the move below the May 2023 low of $11.3050.
The Teucrium Soybean Fund (SOYB) monthly chart is showing a major downtrend. The February low of $23.79 took out the May 2023 low of $23.83. SOYB closed February at $24.09, down $1.64 for the month. Theoretical Positions: Investors might’ve gone long at the June close of $27.32. If so, technically, sell stops would’ve been triggered below the previous 4-month low of $26.59 from October 2023. This would’ve resulted in a loss of $0.74. There are no new positions at the end of February.


