
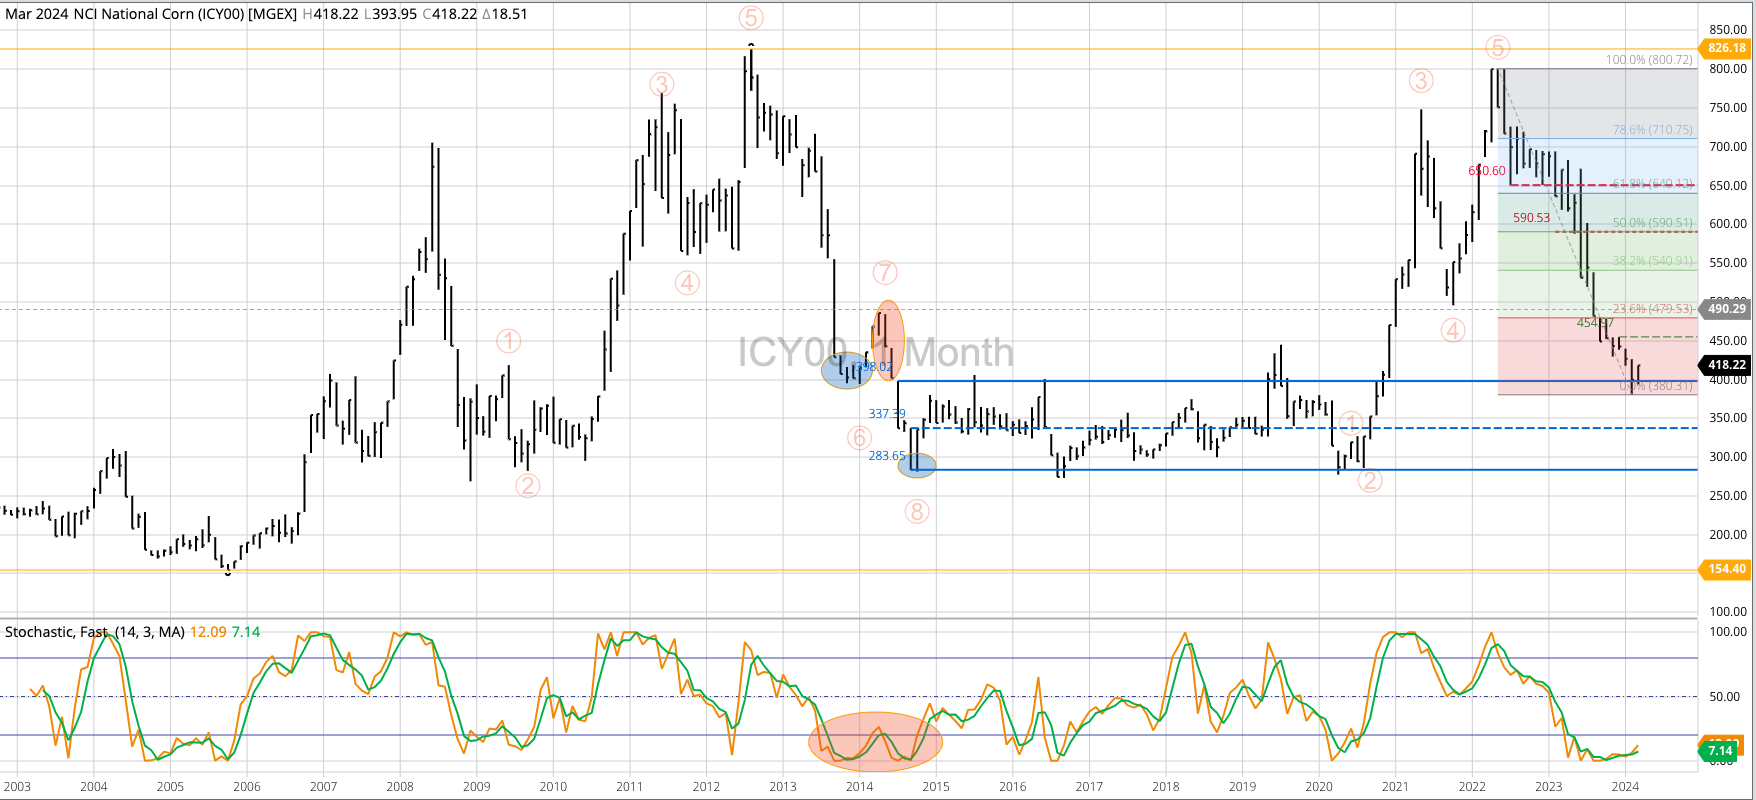


Corn Cash Index: The National Corn Price Index (NCI, national average cash price) posted an inside month during March, opening the door to a possible end of the previous major (long-term) downtrend. While there continues to be a number of similarities between 2024 and 2014, when the latter rallied through April then moved lower through October, for now it could be argued the cash index has turned sideways. Resistance is at the previous 4-month high of $4.3829 with support at the February low of $3.8031. Theoretical Positions: Continue to buy cash corn as needed only, with longer-term buy stops above the previous 4-month high.
December Corn: Dec24 also looks to be in a major sideways trend with support at the double bottom lows of $4.47 (November 2023) and $4.46 (December 2023) and resistance the December 2023 high of $5.13.
Theoretical Positions:
- Hedgers:
- Dec24 and Dec25 hedges established during 2022 and 2023 continue to be held (see Weekly Analysis).
- Some short hedges may have been lifted when Dec24 completed a bullish key reversal on its weekly chart the week of February 26 through March 1.
- If short positions are still held, new-crop short-dated July $4.60 put options were sold for 23.0 cents during March (see Weekly Analysis). These put options closed the week at 12 1/8 cents.
- Dec24 and Dec25 hedges established during 2022 and 2023 continue to be held (see Weekly Analysis).
- Traders:
- Still holding short Dec24 futures after rolling from Dec23 at a strong carry during November 2023.
- Buy stops would be above the December 2023 high of $5.13.
Teucrium Corn Fund (CORN) posted an inside month during March. Theoretical Positions: None at this time. Buy stops would be above the previous 4-month high of $22.40 (December 2023).


