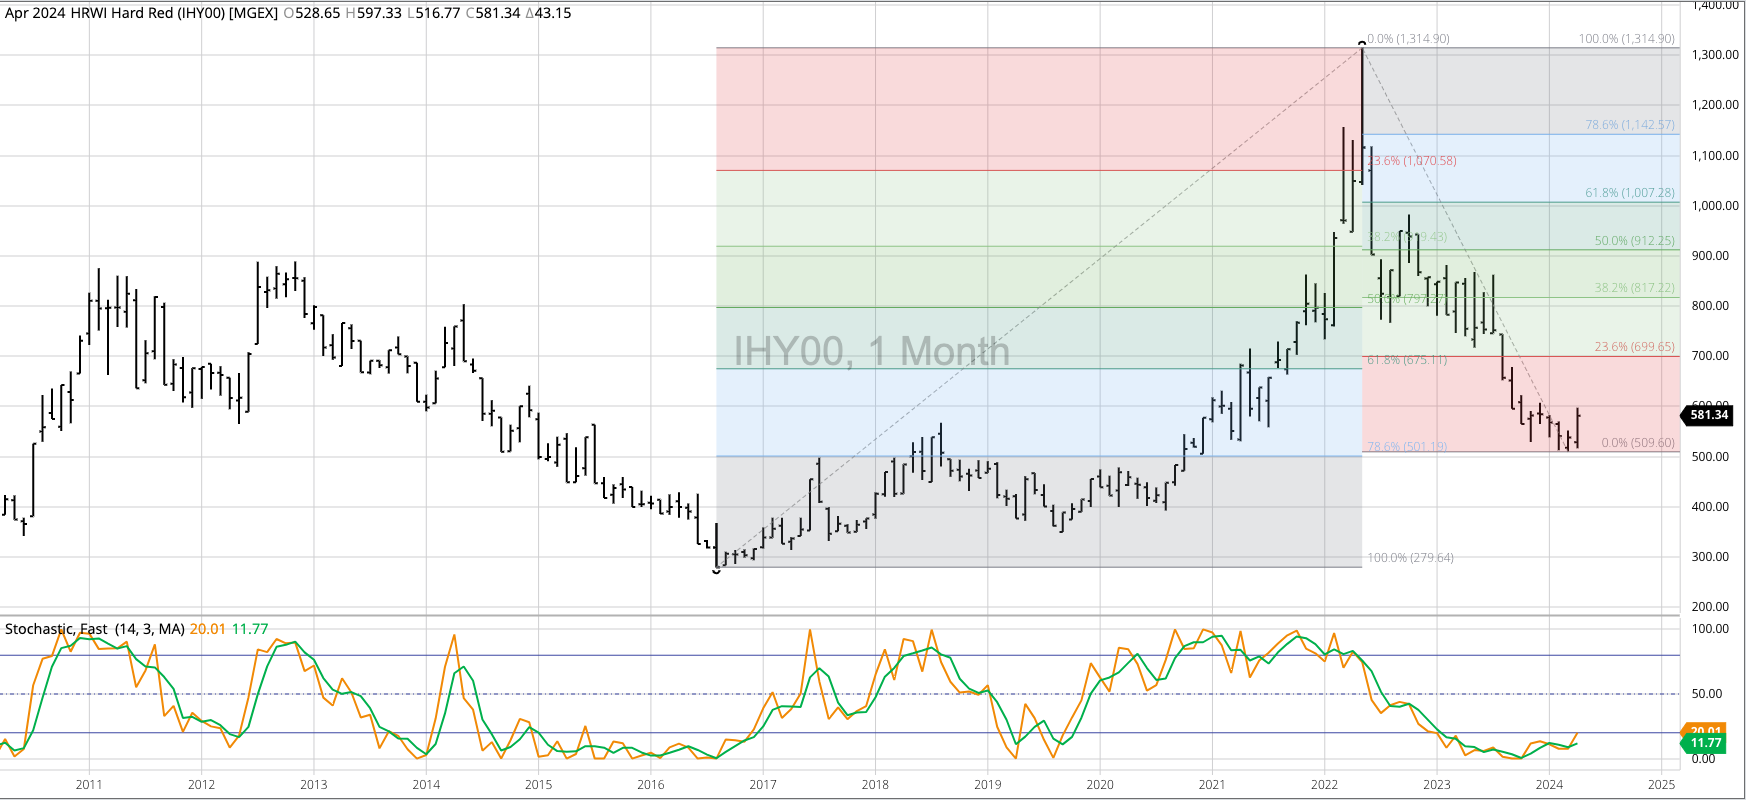


The HRW Wheat Price Index (IHY00, national average cash price) completed another bullish spike reversal during March, again indicating the major (long-term) trend had turned up. The index extended this move to a high of $5.9733 during April, just short of the previous 4-month high at $6.0728 (December 2023). Theoretical Positions: While 2023 cash bushels have likely been sold, traders could’ve gone long the market near the March settlement of $5.3819 based on the latest bullish spike reversal. If so, sell stops would be placed below the March low of $5.0960.
The SRW Wheat Price Index (IWY00) remains in major uptrend after posting a bullish outside range during November. The index closed lower three consecutive months through March, a move that looked to be Wave 2 of a the 5-wave uptrend pattern. Wave 3 would now be expected to take out the Wave 1 high of $5.7083 from December 2023. Theoretical Positions: All 2023 cash bushels should be sold. Traders might’ve bought the market near the November settlement of $5.20 with longs added near the March settlement of $5.0579. This put the average position near $5.13, with sell stops below the March 2024 low near $4.74.
The HRS Wheat Price Index (IPY00) moved into a major uptrend, completing a bullish key reversal during April. Next resistance is at the previous high of $7.0303 from December 2023. Theoretical Positions: Cash bushels were sold at harvest. Those wanting to be long the market could do so near the April settlement of $6.80, putting sell stops below the March low of $6.07.
The Teucrium Wheat Fund (WEAT) extended its major uptrend to a high of $5.94 during April before closing at $5.69, up $0.28 for the month. Heading into May, the previous 4-month high is $5.97 from January 2024. Theoretical Positions: Traders could’ve bought WEAT near the March close of $5.41 with sell stops below the March low of $5.02.