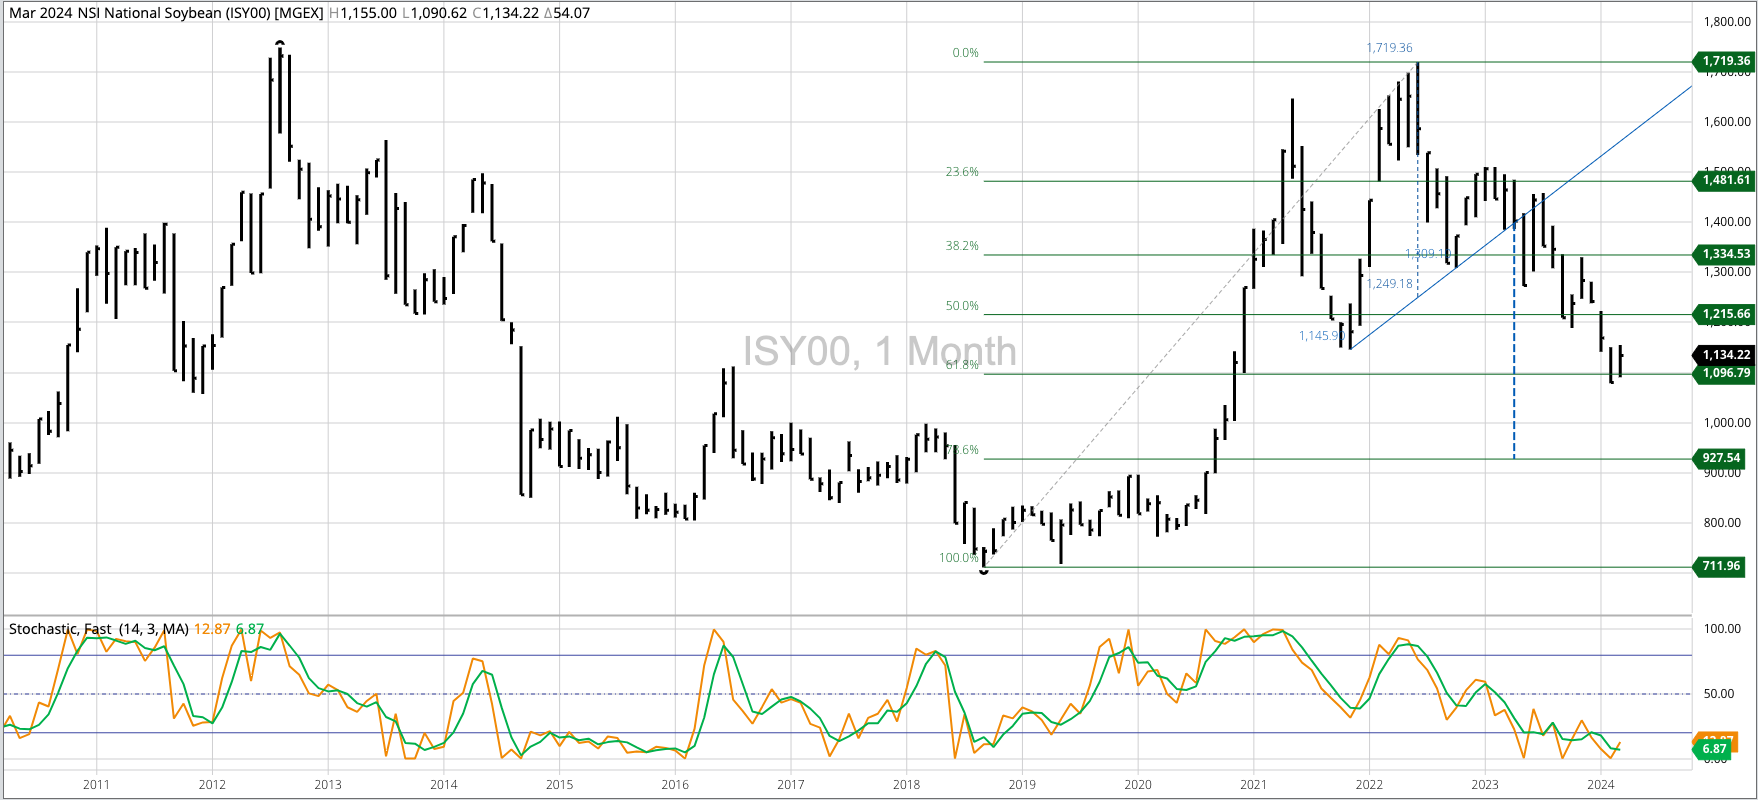


Soybean Cash Index: The Soybean Price Index (ISY00, national average cash price) looks to have completed a possible bullish 2-month reversal during March. If so, then the major (long-term) trend would be considered up. I’m not completely convinced of this pattern given the previous head and shoulder top downside target was not reached. The market has posted bullish reversal patterns before, most recently during October 2023, and had them fail. We’ll see what happens this time. Theoretical Positions: Remaining cash bushels from the 2023 harvest would’ve been sold on sell stops below the October low of $11.8872. End users could continue to buy on an as-needed basis.
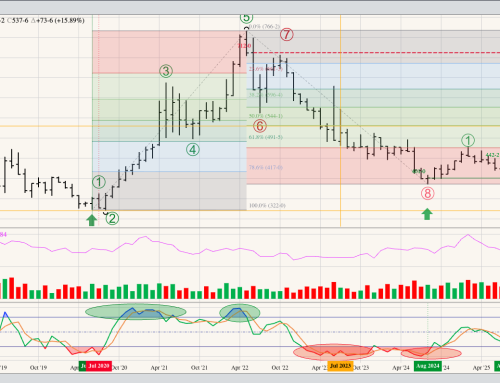
November Soybeans: The November 2024 contract also looks to have completed a bullish 2-month reversal at the end of March. If so, then the February low of $11.2275 would be considered the end of the previous 8-wave cycle (5 waves up, 3 waves down). Theoretical Positions: Sell stops might’ve been triggered below the previous 4-month low of $12.5050 (October 2023, the Nov23 contract). Additional stops might’ve been triggered in late February with the move below the May 2023 low of $11.3050. If so, long-term short positions in Nov24 could be covered near the March close of $11.8625 for a small net gain. If going long Nov24, sell stops would be placed below the February low of $11.2275.
The Teucrium Soybean Fund (SOYB) looks to have completed a bullish 2-month reversal as well. Theoretical Positions: Investors could reestablish long positions near the March settlement of $25.21 with sell stops below the February low of $23.79.