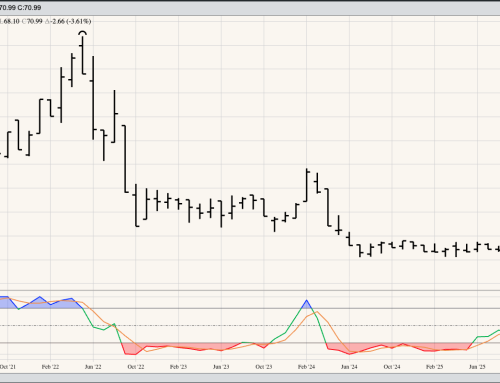
I’m going to call the major (long-term) trend on the WTI crude oil chart sideways, with a wide range between the previous 4-month high of $130.50 (March 2022) and 4-month low of $93.53 (also March 2022). June saw the spot-month contract close $8.91 lower for the month, the first lower monthly close since November 2021. Meanwhile, monthly stochastics are indicating the market has topped while the market’s forward curve remains inverted telling us long-term fundamentals are still bullish. Noncommercial traders have been taking money out of the market due to the general lack of trend.
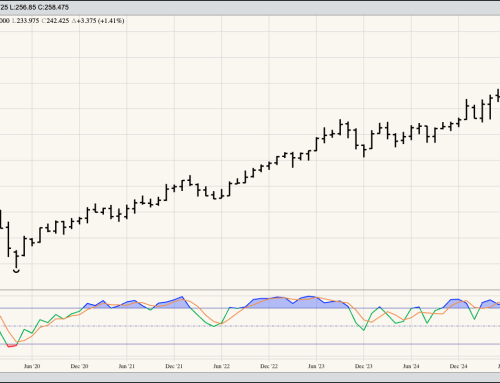
The monthly chart for Brent crude is similar to WTI with the spot-month contract holding within the range from the past March between $137.00 and $96.95. While monthly stochastics, a technical indicator, remains bearish the market’s inverted forward curve continues to reflect bullish long-term fundamentals. Given this, a theoretical trading strategy could be to trade the range with options (likely from the short side) until a clear breakout is signaled with a new 4-month high or low.
Distillates (heating oil, jet fuel, diesel fuel, etc.) are showing similar patterns to the crude oil markets, with the key being neutral-to-bearish technical while long-term fundamentals remain bullish. Technically the difference is small, with the previous 4-month high posted during April at $5.2217 rather than during March with the crude oil markets. The previous 4-month low is the March number of $2.9299. The deeper we get into summer the close we get to seasonal buying season for winter needs, not just in the US but globally.
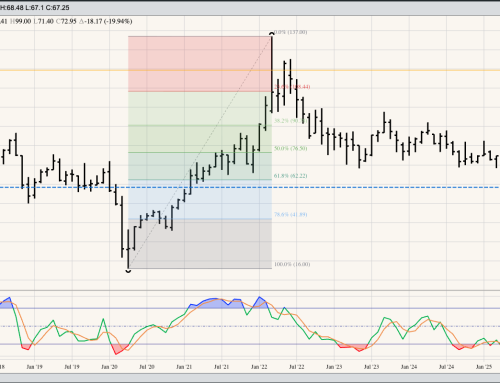
RBOB gasoline completed a bearish spike reversal during June, a pattern that would seem to confirm the bearish crossover by monthly stochastics from the end of August 2021. This combination would suggest the major (long-term) trend had turned down, within initial support at the previous 4-month of $2.8861. As with the other markets, RBOB’s long-term fundamental outlook remains bullish, as indicated by its inverted forward curve. This could limit selling interest in the market over the coming months.
Natural Gas posted a wild month of June as it not only put a peak on the previous major (long-term) 5-wave uptrend but did so with an impressive bearish key reversal. This sets the stage for – who am I kidding, it’s natural gas, so anything can happen. From a technical point of view, though, the market could continue to fall or immediately move into Wave B (second wave) of its new 3-wave major downtrend. Note June’s activity already saw the spot-month contract post a 50% retracement of the previous uptrend, with support at the previous 4-month low of $4.34. Again, anything can happen with the Widow Maker so if trading it, do so with extreme caution.