The S&P 500 ($INX) remains in a major (long-term) 5-wave uptrend. Seasonally, the S&P tends to move lower during August and September before rallying through the end of the year.. Theoretical Positions: Long from the October 2022 close of 3,871.98 with a stop below the May 2023 low of 4,048.28.
The Dow Jones Industrial Average ($DOWI) remains in a major 5-wave uptrend. As with the S&P 500, it would not be surprising to see the $DOWI move lower during September. Theoretical Positions: Long from at least the October 2022 settlement of 32,732.95 if not the breakout of the September high at 32,504.04. Stops would be placed below the 4-month low of 32,586.56 from May 2023.
The Nasdaq ($NASX) remains in a major uptrend. As with the other indexes, the August lower close could lead to continued pressure during September. Theoretical Positions: Long from the October 2022 close of 10,988.15 with a stop below the April 2023 low of 11,925.37 from May 2023.
The US 10-year T-note (ZN) remains in a major sideways trend. Key support is at the low of 108-265 from October 2022. Theoretical Positions: It’s possible longs might’ve been established at the November 2022 close of 113-070 based on monthly stochastics and a possible 2-month reversal. Additional longs could’ve been established when the ZN took out the high of 116-080. If so, the average long would be roughly 114.575. Stops would be placed below the October 2022 low of 108-265.
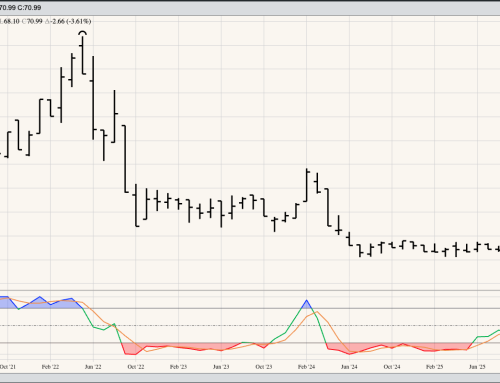
Gold (Cash Index): The cash index still looks to be in a major downtrend after completing a bearish key reversal during May. The index extended its downtrend to a new 4-month low of $1,884.95 during August before rallying to close the month at $1,939.95. Theoretical Positions: Short positions could’ve been established near the May settlement of $1,962.56 , with a buy stop above the May high of $2,059.31 (risk of $96.75).