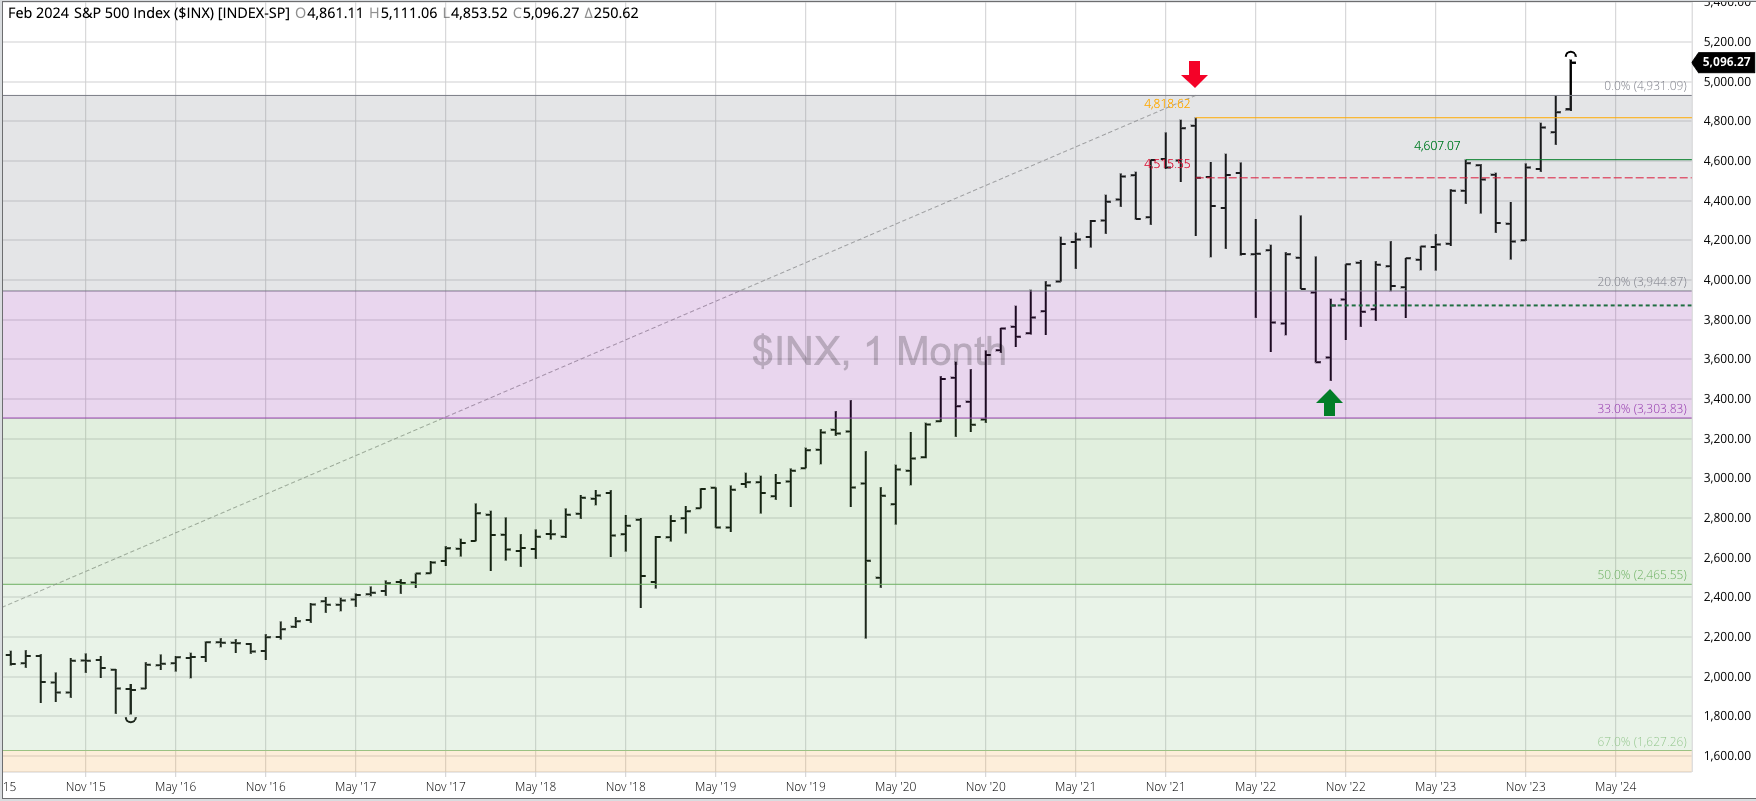


The S&P 500 ($INX) remains in a major (long-term) uptrend, posting a new all-time high of 5,111.06 during February before closing at 5,096.27, up 250.62 for the month. Seasonally, the $INX tends to move lower during February and March with the early contra-seasonal trend indicating real fundamentals, whatever they might be, are more bullish than usual this year. Theoretical Positions: Long from the October 2022 close of 3,871.98. Sell stop below the previous 4-month low of 4,197.74 (November 2023).
The Dow Jones Industrial Average ($DOWI) remains in a major (long-term) uptrend, posting a new all-time high of 39,282.28 during February before closing at 38,996.39, up 846.09 for the month. Seasonally the $DOWI tends to move lower during February and March with the early contra-seasonal trend indicating real fundamentals, whatever they might be, are more bullish than usual this year. Theoretical Positions: Long from at least the October 2022 settlement of 32,732.95 if not the breakout of the September high at 32,504.04. Sell stops would be below the previous 4-month low of 33.010.85 (November 2023).
The Nasdaq ($NASX) remains in a major uptrend. The $NASX posted a high of 16,132.00 during February with its all-time high at 16,712.23 from November 2021. The $NASX posted a new high monthly close of 16,o91.92. Theoretical Positions: Long from the October 2022 close of 10,988.15. Sell stops would be placed below the previous 4-month low of 12.875.20 (November 2023).
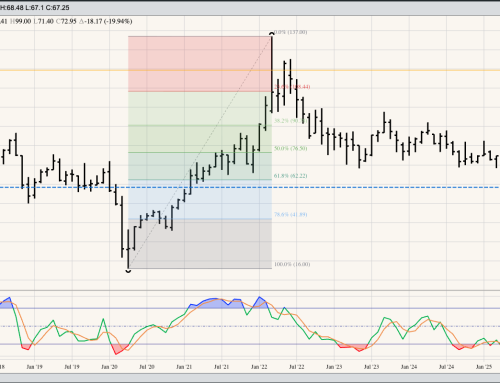
The US 10-year T-note (ZN) remains in a major uptrend with the February selloff looking like the beginning of a Wave 2 (out of 5 wave) move. If so, the 10-year could retrace much of Wave 1, putting a downside target near 107-00. Theoretical Positions: New longs might’ve been established near the November 2023 close of 109-150. Others may be waiting for a retracement. Either way, sell stops would be placed below the October 2023 low of 105-105.