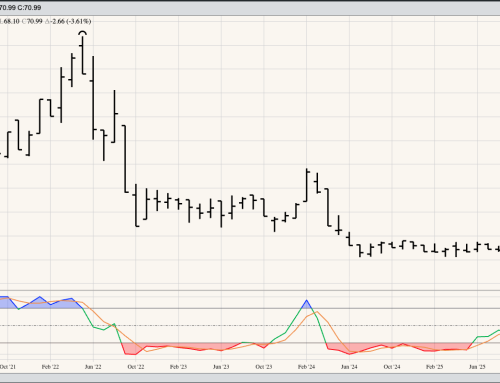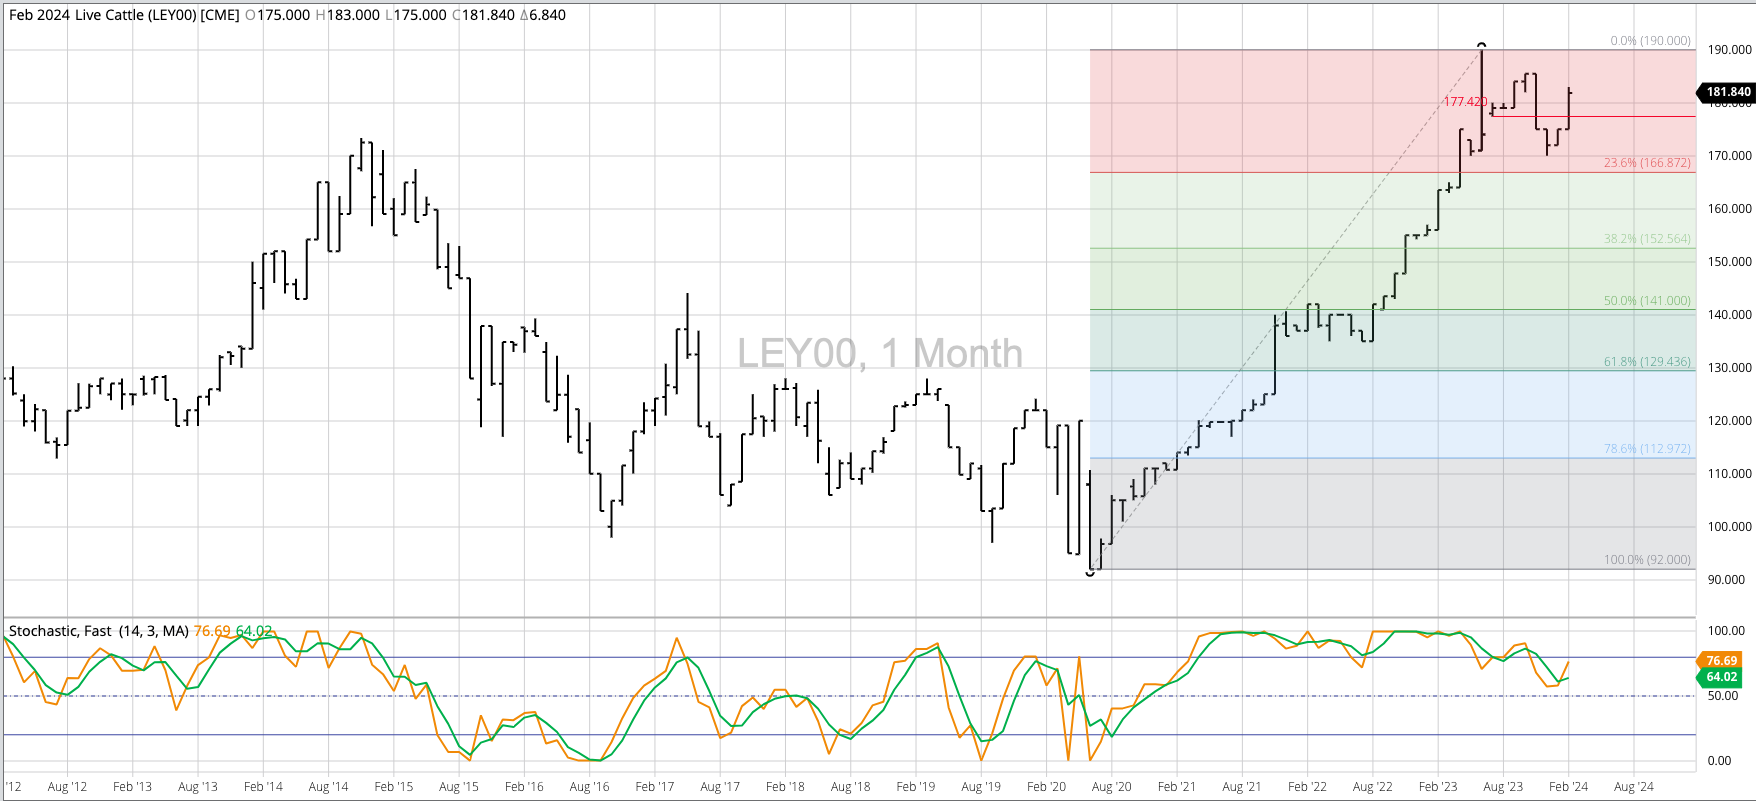


Live Cattle (Cash Index): The live cattle cash index remains in a major (long-term) downtrend despite the strong rally during February. We need to keep a close eye on the index as a move above the previous 4-month high of $185.50 could spark an extended rally to test the all-time high of $190.00 (June 2023). Theoretical Positions: Hedgers likely rolled put options up during the previous major uptrend and sold cash as needed. Deferred hedges were likely put in place when the cash index posted a new 4-month low during November. Those hedges would continue to be lifted and cash sold, with long put options still a good hedge strategy.
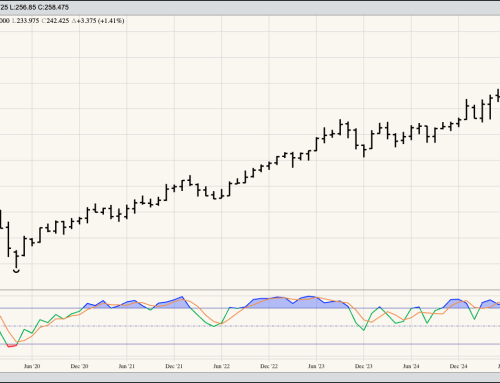
Feeder Cattle (Cash Index):Similar to live cattle, the cash feeder cattle index remains in a major downtrend despite strong rallies in January and February. Based on a Benjamin Franklin Fish Analogy (Like guests and fish, markets start to stink after three days/weeks/months of moving against the trend), the index could trade higher again during March. This would still be viewed as Wave B (second wave) of the 3-wave downtrend pattern. The test will be the previous high of $254.10 (September 2023). Theoretical Positions: As with live cattle, hedgers have likely continued to roll put options up and sell cash. Additional sales could be made on a possible Wave B (second wave) top within the major 3-wave downtrend.
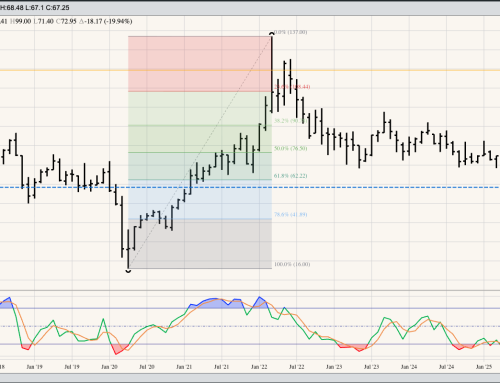
Lean Hogs (Cash Index): The cash index completed a bullish key reversal during January, confirming the major trend has turned up. This pattern was completed in conjunction with a bullish crossover by monthly stochastics below the oversold level of 20%. The index extended its move to a high of $79.907 during February before closing at that price. Theoretical Positions: New long positions could’ve been established near the February low was $72.710 with stops below the January low of $65.048.