

Side Note: Like many other market sectors, much of what I am about to discuss in Monthly Analysis: Metals is null and void given market activity on Thursday, May 1.
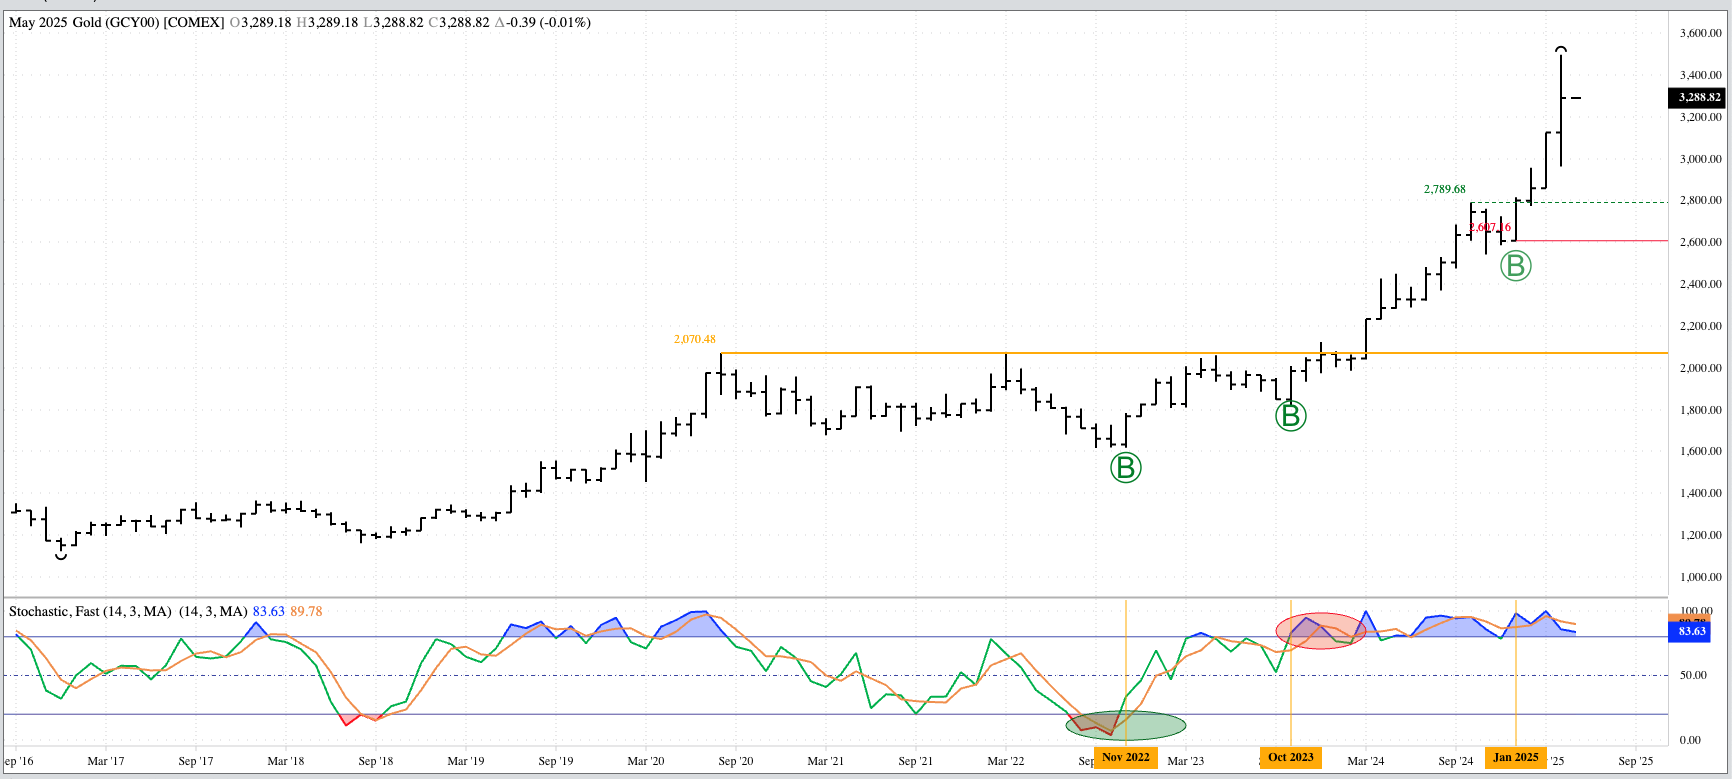
Gold (Cash Index): The cash index (GCY00) extended its major (long-term) uptrend to a new all-time high of $3,495.89 before closing April at $3,289.21, up $165.25 (5.3%) for the month. However, midday Thursday (May 1) finds the June futures contract down as much as $109.70 and the Cash Index losing as much as $84.30. Theoretical Positions: It’s possible investment traders bought near the October 2023 close of $1,983.91 as previous short positions were stopped out. There have been numerous buys, mostly on new 4-month highs, since the key bullish reversal completed during November 2022. Sell stops would be placed below the previous 4-month low of $2,607.16 (January 2025)
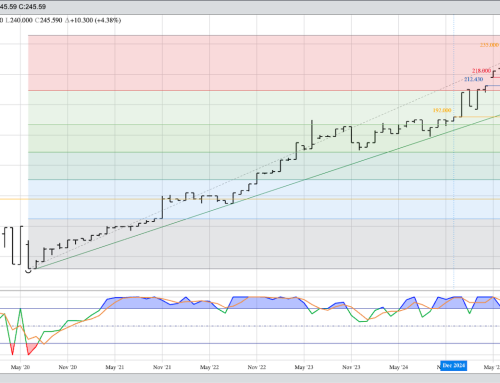
Silver (Cash Index): The cash index (SIY00) is a more difficult read, from a technical point of view. The Index fell to a low of $28.5963 during April, possibly stopping out previous long positions, before rallying to close at $32.6151. This was still a loss of $1.47 for the month. Theoretical Positions: Traders might’ve gone long as a new 4-month high ($25.7691) was posted during April 2024. If so, sell stops might’ve been triggered below the previous 4-month low of $28.7926 during April 2025, resulting in a gain of $3.02353 (11.7%).
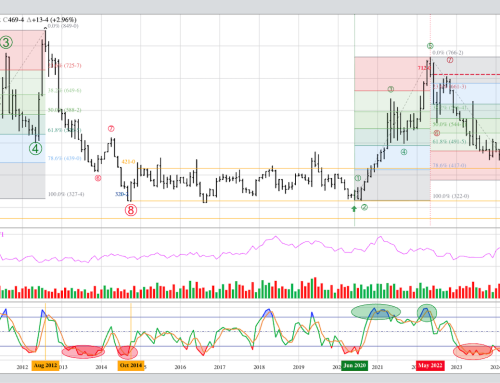
Copper (Cash Index): The Index was under pressure most of the month before closing April at $4.5645, down $0.4675 (9.3%) from its March settlement. Theoretical Positions: New longs might’ve been established as the index took out its previous 4-month high of $4.5930 (October 2024). Additional longs might’ve been established beyond the previous all-time high. If so, the average position would be roughly $4.8580. Sell stops would be below the previous 4-month low at $4.2495 (January 2025).