


I’ve changed my monthly discussion of real month-end fundamentals for the various grain markets. I’m simplifying the conversation by applying the Law of Supply and Demand: Market Price is the point where the quantity demanded equals quantities available creating a market equilibrium. My take on this Law is tweaked by looking at “available supplies” rather than “total supplies”, an important distinction in the Grains sector given supplies can be held off the market in on-farm or commercial storage. If we consider the three variables in the equation (Price = Supply, Demand) the only one known is Market Price. Therefore, a study of Market Price is all that is needed to understand the relationship between the unknown variables of Supply and Demand. My monthly updates will look at the most recent end of month market price compared to last month, the previous quarter, and previous year. This tells us how supply and demand are changing in relation to each other even though we don’t/won’t/can’t know the actual numbers.
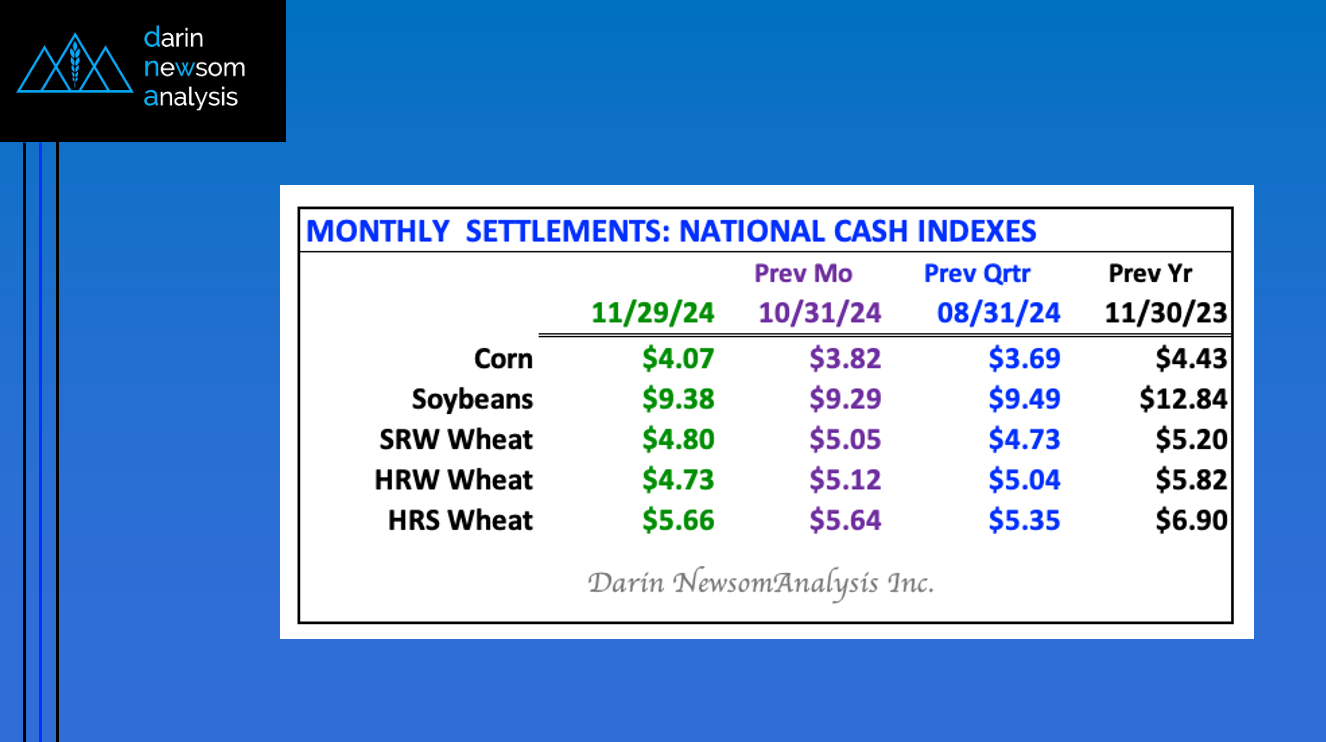
CORN: The National Corn Index (NCI) was calculated near $4.07 at the end of November, its highest monthly close since May 2024 near $4,26. The recent low monthly close was $3.6850 at the end of August. This tells us despite the 2024 US harvest coming in over the past quarter (September through November), demand has increased in relation to available supplies. This is an important distinction, available supplies, as much of the 2024 harvest is likely being held in on-farm storage. That being said, corn futures spreads are long-term bullish through next spring as well (see Weekly Analysis).
SOYBEAN: The National Soybean Index (NSI) was calculated near $9.3750 at the end of November, up slightly from the October 31 price near $9.2925 but still below the end of August settlement of $9.4862. This tells us a couple things: 1) Supplies increased as the 2024 harvest came in, as expected, and 2) Demand increased during November. December could see more of the same given the threat of increased tariffs and trade wars once January rolls around. It’s interesting to note that the NSI was price at $12.8385 a year ago (November 2023) telling us just how much more bearish supply and demand has become.
SRW WHEAT: The National SRW Wheat Index (SWI) was calculated at $4.7989 as November 2024 came to an end. This was still above the August price of $4.7309 but below the November 2023 settlement of $5.2018. US SRW wheat supply and demand has not change all that much, with concern growing with a look ahead into 2025. The recent low monthly close is $4.6065 from September 2023.
HRW WHEAT: The National HRW Wheat Index (HWI) was calculated at $4.7311 on November 29, 2024, its lowest monthly close since $4.4786 at the end of August 2020. This tells me the supply and demand situation is as bearish as it has been in over 4 years, a fact made more interesting by increased export demand through the first half of the 2024-2025 marketing year. As reported in weekly export sales and shipments updates, total shipments for US HRW wheat are running 77% ahead of last marketing year’s pace for the same week. The bottom line is US supplies are large, to say the least.
HRS WHEAT: The National HRS Wheat Index (HSI) was calculated at $5.5870 on November 29, 2024, holding above the end of August price of $5.3535 but below the November 2023 figure of $6.8999. HRS is a mix of the winter markets with its supply and demand situation stabilizing like SRW while year-to-year exports have increased 21% similar to HRW. The bottom line is supplies still look to be cumbersome in relation to demand.


