Corn futures spreads: Neutral-Bearish
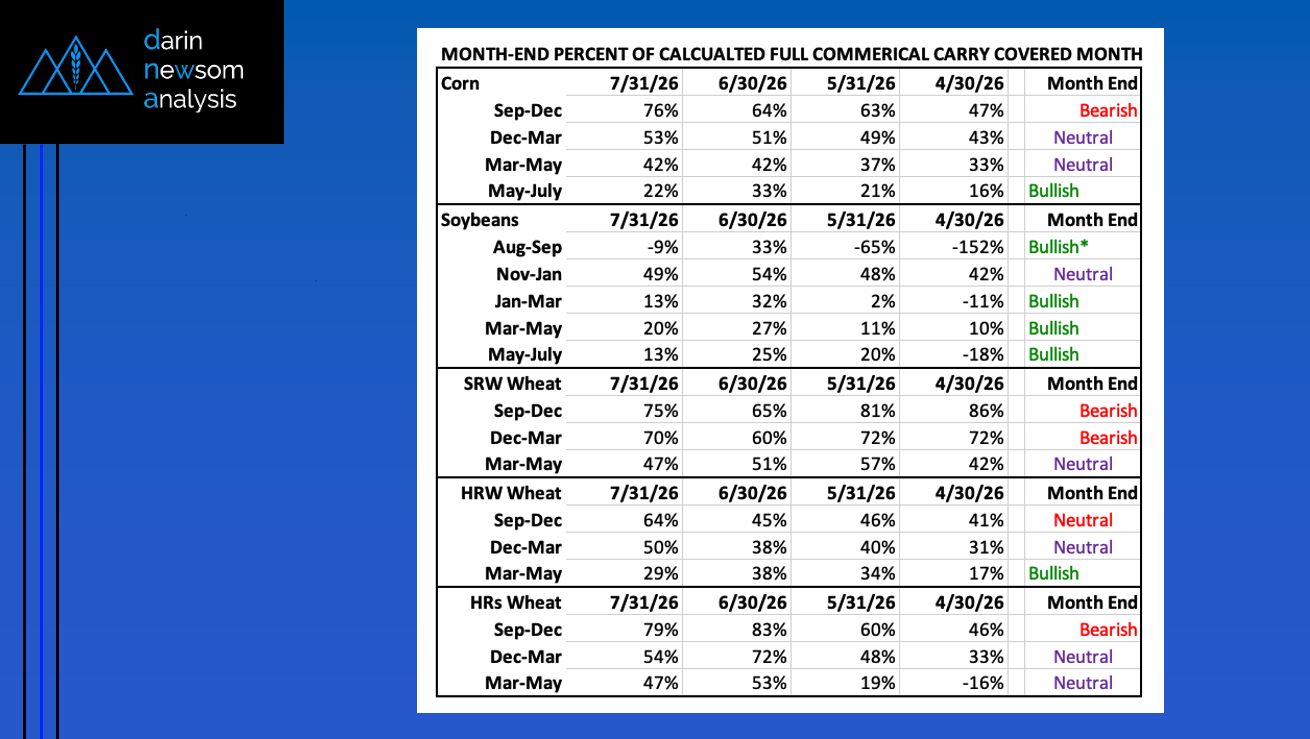
- September-December closed July covering a bearish 76%
- as compared to the end of June 64%
- continuing the trend of higher percent covered meaning supplies continue to grow in relation to demand
- December-March closed July covering a neutral 53%
- as compared to the end of June of 51%
- also continuing the trend of higher percent covered meaning the commercial side is growing more comfortable with 2026 production.
- March-May closed July covering a neutral 42%
- as compared to the end of June 42%
- May-July closed July covering a bullish 22%
- as compared to the end of June 33%
- The June figure still looks to be an outlier.
- Bottom Line: At the 2/3-mark of 2026 summer quarter, there doesn’t seem to be much concern over the US 2026 crop. A down escalator simulator is possible meaning the Dec-March could follow the same track as the Sep-Dec. Further out, we can see there is a question with the May-July spread still bullish.
Soybean futures spreads: Neutral-Bullish
- August-September closed July at an inverse of 1.25 cents (-9%)
- While indicating a bullish short-term supply and demand situation, it’s the two Jar Jar Binks contracts so we can’t read much into what we see.
- November-January closed July covering a neutral 49%
- as compared to the end of June of 54%
- Indicating a few more questions regarding the 2026 US crop due to the hot and dry forecast for early August.
- January-March closed July covering a bullish 13%
- as compared to the end of June 32%
- The June figure still looks to be an outlier, with the general trend dating back to April being more commercial carry covered at month-end.
- March-May closed July covering a bullish 20%
- as compared to the end of June 27%
- The general trend is still toward more commercial carry covered meaning less concern over Brazil’s 2027 crop.
- May-July closed July covering a bullish 13%
- as compared to the end of June 25%
- Low trade volume, but still indicating the commercial side is keeping an eye on long-term supply and demand.
- Bottom Line: There is a general concern over global supply and demand, particularly with Brazil’s 2027 crop and an expected increase in demand from China.
SRW Wheat futures spreads: Bearish
- September-December closed July covering a bearish 75%
- as compared to the end of June 65%
- December-March closed July covering a bearish 70%
- as compared to the end of June of 60%
- March-May closed July covering a neutral 47%
- as compared to the end of June 51%
- Bottom Line: Chicago SRW is the world’s largest wheat futures market. With the first two spreads covering bearish levels of calculated full commercial carry we know the world isn’t running out of wheat any time soon.
HRW Wheat futures spreads: Neutral
- September-December closed July covering a neutral-to-bearish 64%
- as compared to the end of June 45%
- The large change due to the CME’s Variable Storage Rate program coming into play on July 19.
- December-March closed July covering a neutral 50%
- as compared to the end of June of 38%
- March-May closed July covering a neutral 29%
- as compared to the end of June 38%
- Bottom Line: Let’s give HRW spreads another month to sort itself out following the latest application of the CME’s VSR.
HRS Wheat futures spreads: Neutral-Bearish
- September-December closed July covering a bearish 79%
- as compared to the end of June 83%
- December-March closed July covering a neutral 54%
- as compared to the end of June of 72%
- March-May closed July covering a neutral 47%
- as compared to the end of June 53%
- Bottom Line: Given the lack of trade volume and open interest, the key is the first two spreads covering less calculated full commercial carry at the end of July.