
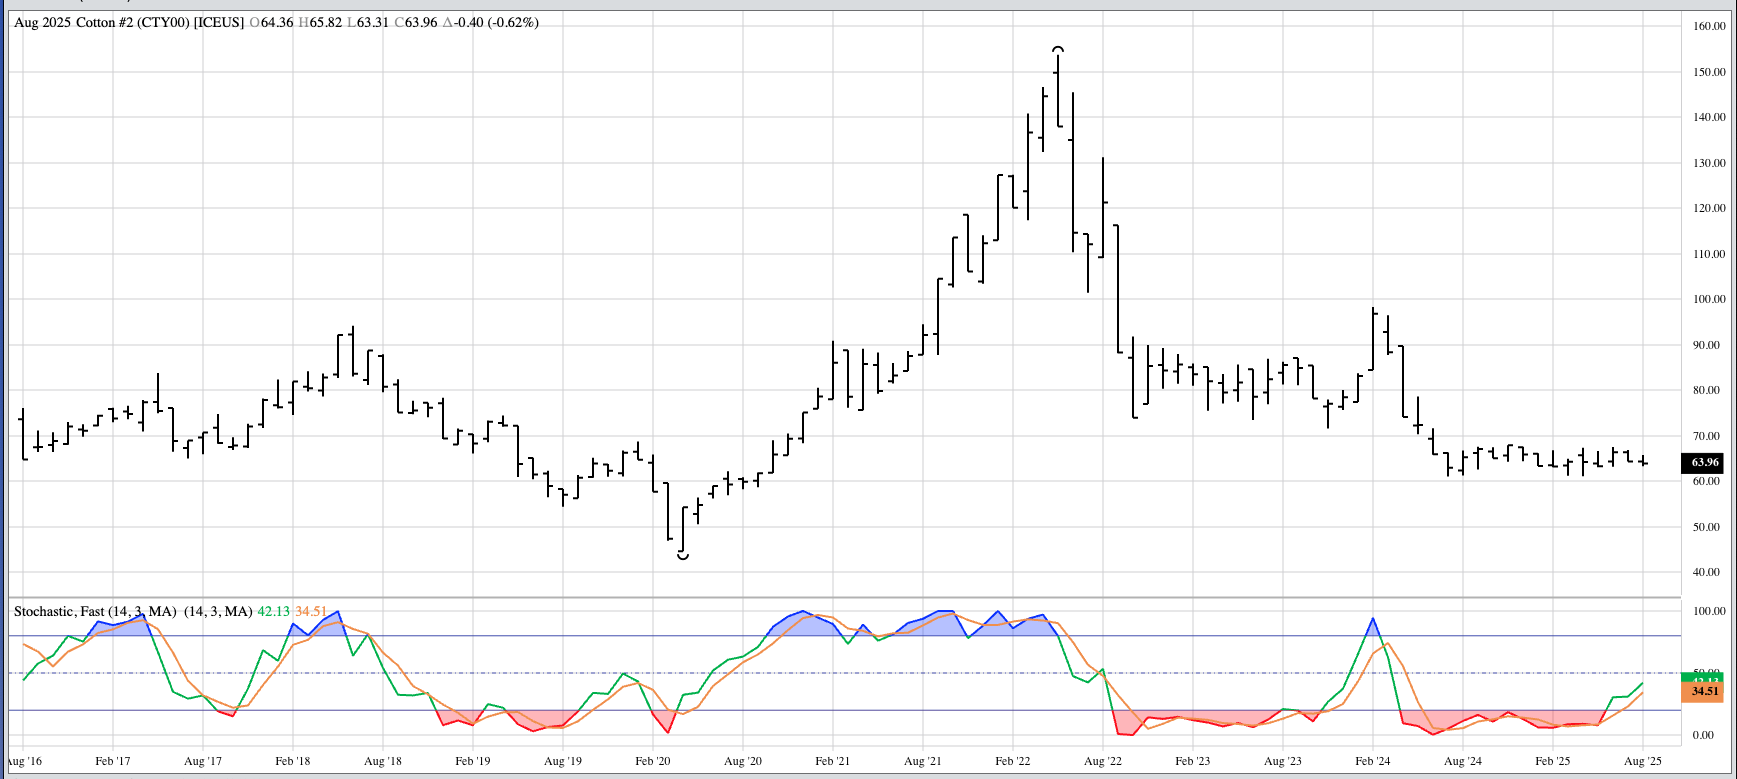


Cotton (CTY00, Cash Index): The cotton market remains in a major (long-term) sideways trend. Theoretical Positions: Long-term investors might’ve bought on the move to a new 4-month high of 67.43 during June. If so, then sell stops would be below the May 2025 low of 63.09. The index closed August at 63.96, down 0.4 for the month.
Coffee (KCY00, Cash Index): Despite its strong rally during August, the Index still looks to be in a major downtrend based on an Elliott Wave 3-wave downtrend pattern. A move beyond the previous high of 438.44 would change that technical view, though. Theoretical Positions: Long-term investors might’ve gone short the market on sell stops below the previous 4-month low of 362.37. Sell stops would be placed above February high of 438.44.
Cocoa (CCY00, Cash Index: It could still be argued the Index is in a major downtrend. Meanwhile, the futures market’s forward curve remains in strong backwardation indicating a long-term bullish supply and demand situation. Theoretical Positions: Long-term investors are likely on the sidelines in cocoa. If holding short positions, buy stops would be above the previous 4-month high of 10,927 (May 2025).
Sugar (SBY00, Cash Index): After extending its major downtrend to a low of 15.56 in July, the Index completed a bullish spike reversal by closing at 16.35, up 0.16 for the month. This coincided with another bullish crossover by monthly stochasitcs below the oversold level of 20%, both indicating and confirming a move to a new major uptrend. The Index extended its new major uptrend to a high of 16.95 during August before closing at 16.34. Theoretical Positions: Long-term investors could’ve bought near the July close of 16.35 with sell stops below the July low of 15.56. The upside target area begins at 20.30.
Orange Juice (OJY00, Cash Index): The Index completed a bullish key reversal during July, following a similar pattern completed this past April, the former coinciding with a bullish crossover by monthly stochastics. This means the index both signaled (stochastics) and confirmed (key reversal pattern) a new major uptrend. This was followed by consolidation during August. Theoretical Positions: Long-term investors bought back short positions near the April close of 272.50 and went long at the same price. It’s possible sell stops below the April low of 211.90 were triggered during July before another buy was signaled at the end of the month. The Index closed July at 260.15, up 45.15 for the month but well off its high of $337.85.


