
My monthly analysis of the key grain and oilseed markets will focus on the cmdty National Price Indexes (weighted national average cash prices). Recall from numerous previous discussions I view these as the intrinsic value of the individual markets meaning long-term monthly charts give us a good read on outlook.
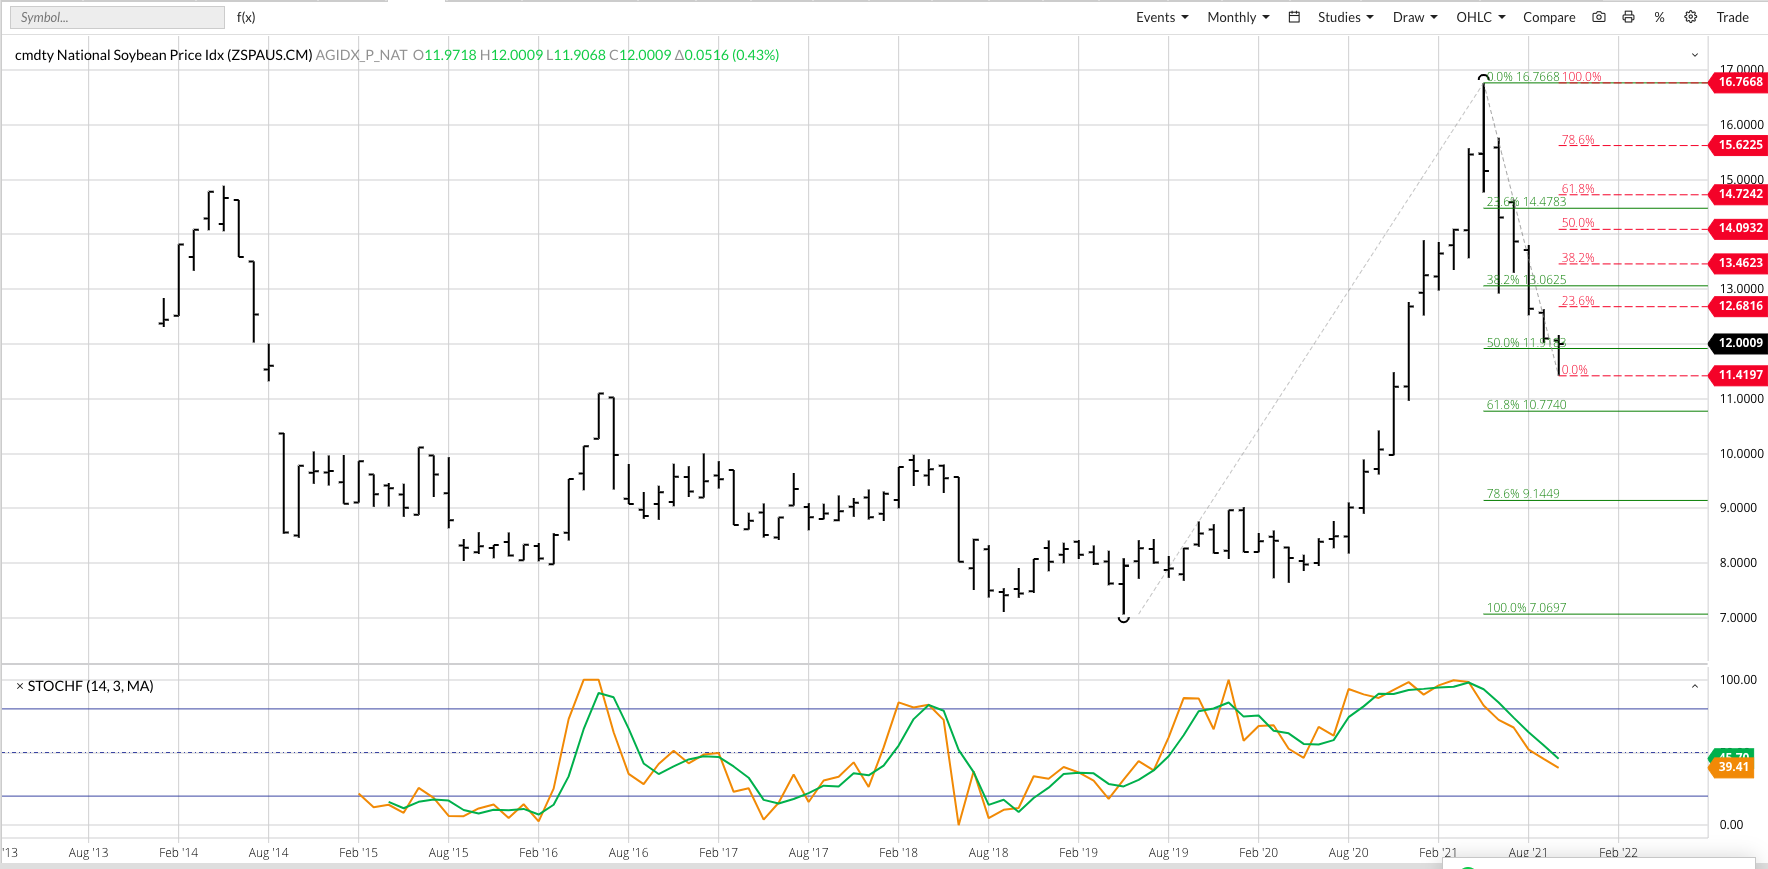
There is a famous book on markets by Benoit B. Mandelbrot titled, “The (Mis)Behavior of Markets”. It’s an interesting read, and one I highly recommend, but in the case of the cmdty National Soybean Price Index (NSPI) the market is behaving itself quite well. Since posting a bearish spike reversal this past May, indicating the major (long-term) trend had turned down, the NSPI dropped to a low of $11.4197 during October before closing the month at $12.0009. This was a direct test of the target price near $11.92, the 50% retracement level of the previous uptrend from $7.0697 (May 2019) through the May 2021 high of $16.7668. The NSPI’s weekly chart shows its secondary (intermediate-term) trend is trying to turn up, a move that would be considered Wave B (second wave) of the major 3-wave downtrend pattern. The initial upside target area is between $13.4623 and $14.0933, once we get a clear confirmation the secondary trend has turned up.


