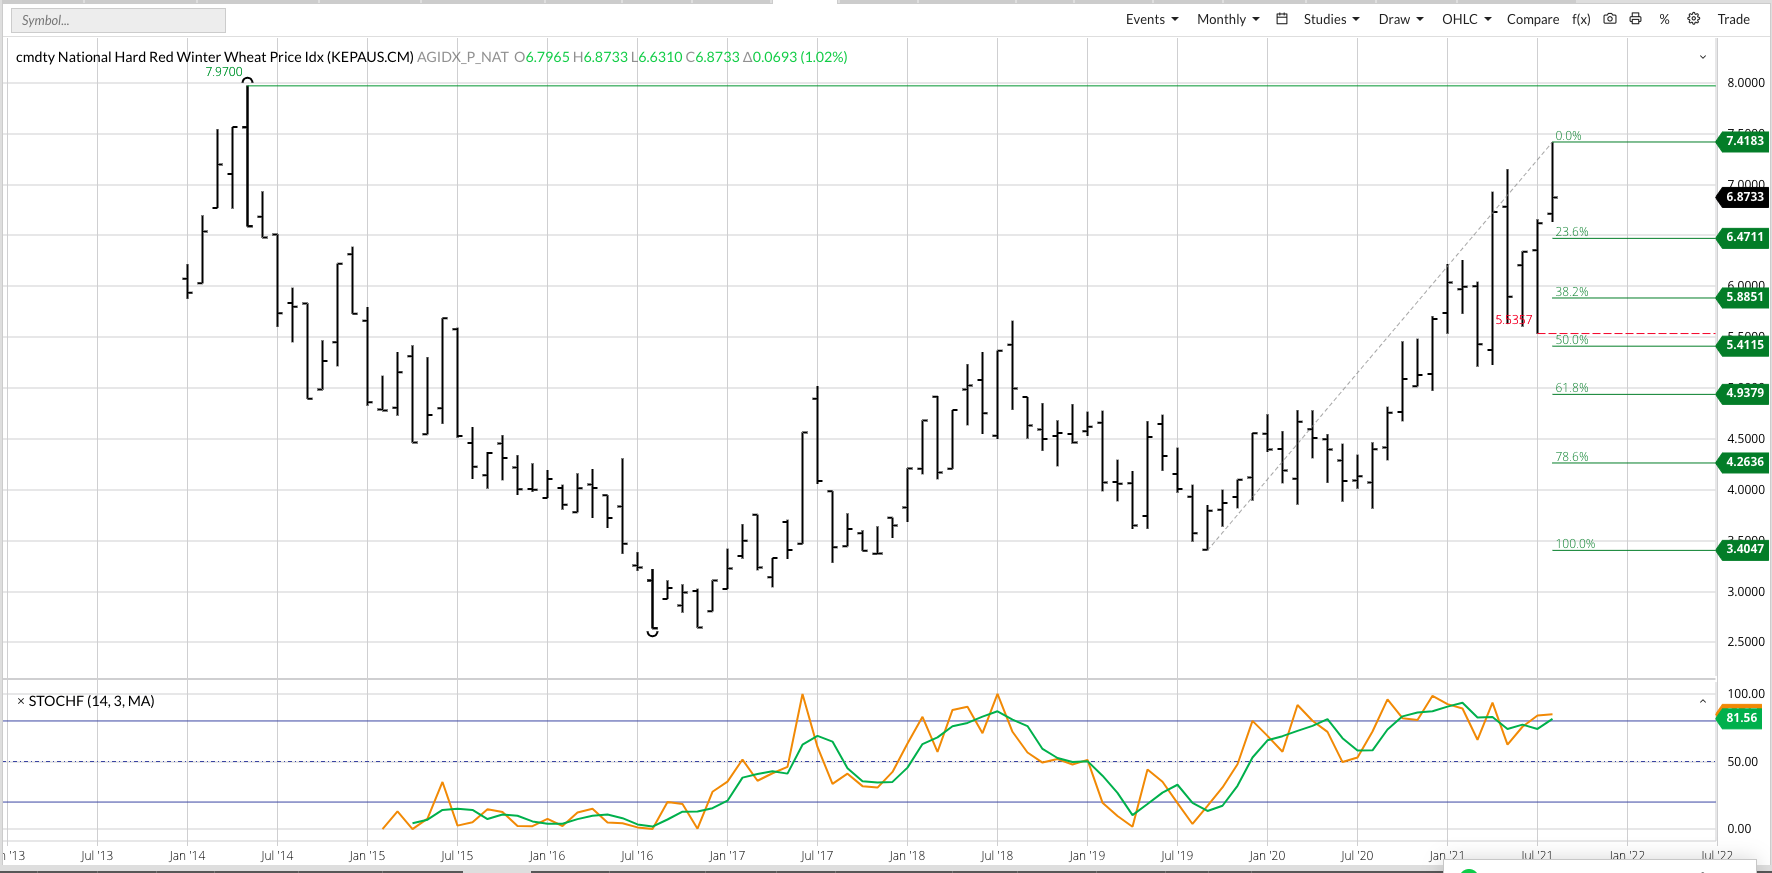
Yes, I know the cmdty National Hard Red Winter Wheat Price Index (HWPI, weighted national average cash price) posted a new high of $7.4183 during August, But by definition* I’m still inclined to classify it in a major (long-term) downtrend that began with the bearish spike reversal during May 2021. This pattern confirmed a bearish crossover by monthly stochastics at the end of February, with the initial Wave A (first wave) selloff taking the HWPI to a low of $5.5357 during July. It’s at this point, though, the picture starts to get a bit murky as the HWPI posted a bearish outside range that month, leading to he August spike to a new high. While this looks incredibly bullish, it could still be considered a Wave B (second wave) move. If so, we would expect Wave C (third wave) to take out the Wave A low with the next downside target at $5.4115.
* The definition of Wave B is, “Depending on the type of correction taking place, the rally may test the old highs (forming a double top) or even exceed the old highs before turning back down.” (Technical Analysis of the Futures Markets, by John J. Murphy. 1986 ed., pg. 379)