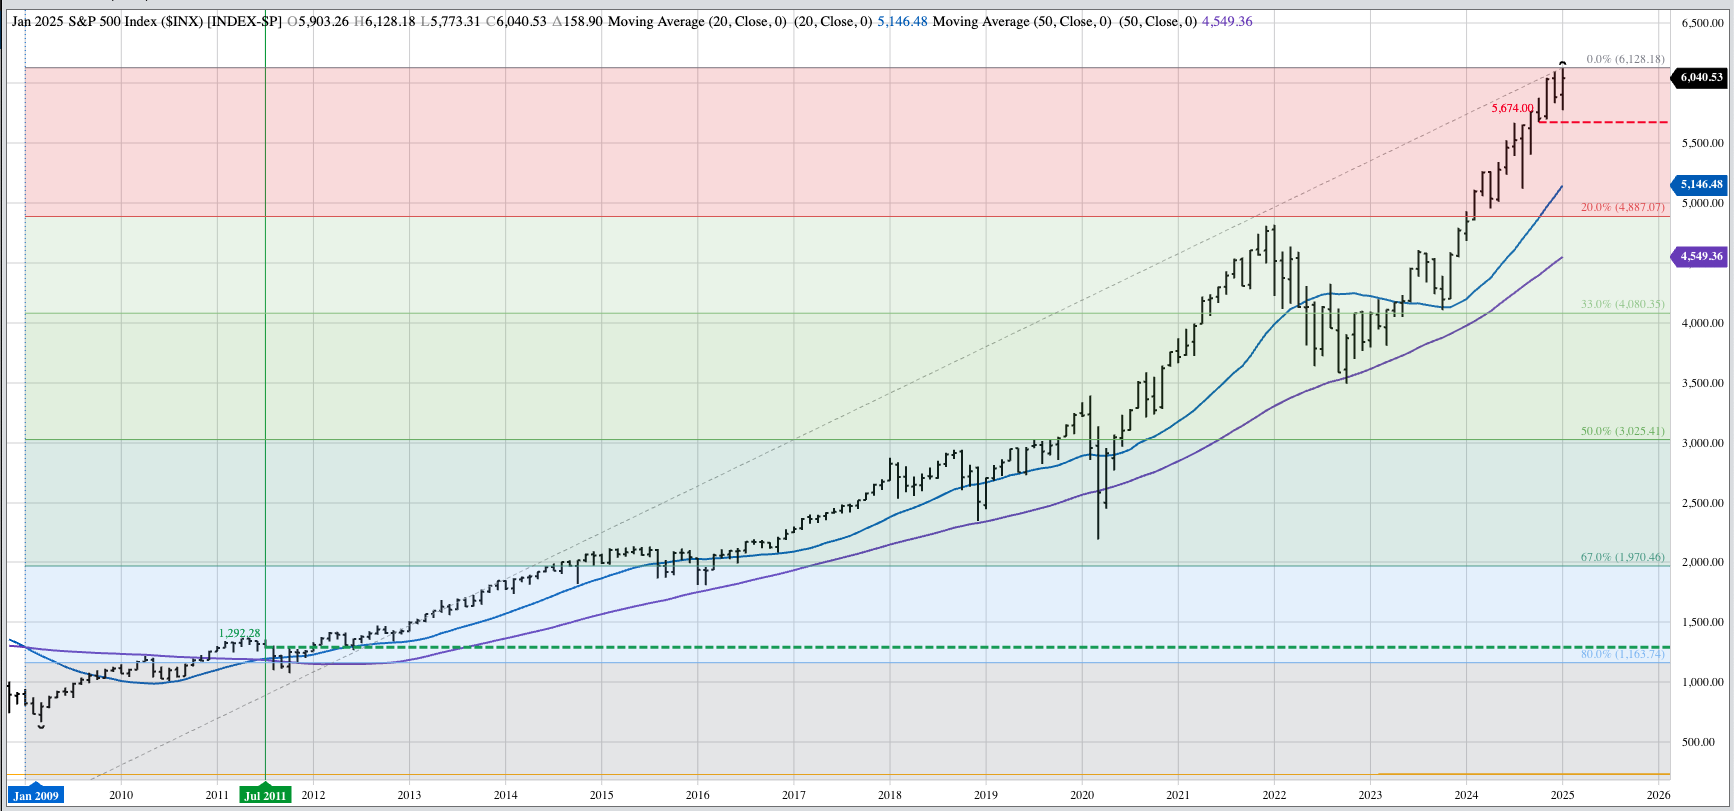


The S&P 500 ($INX) completed a bullish outside month during January, extending the occurrence of conflicting technical patterns to 4 months. Recall the $INX completed a bearish spike reversal during October 2024 before posting a new all-time high in November, followed by a bearish spike reversal during December 2024, and January 2025’s bullish outside range. Putting technical analysis aside, the eyeball test tells us the major (long-term) trend remains up. Theoretical Positions: Long-term investors are likely still long and keeping an eye on a reversal taking the index below its previous 4-month low of 5,674.00 from October 2024. The Index closed January at 6,040.53.
The Dow Jones Industrial Average ($DOWI) also completed a bearish spike reversal during December before closing at 44,544.66 at the end of January, up 2,000.44 for the month. As with the S&P 500, the eyeball test tells us the $DOWI remains in a major uptrend, for now. Theoretical Positions: Long-term investors are likely still long and keeping an eye on a reversal taking the index below its previous 4-month low of 41,647.30 from November 2024.
The Nasdaq ($NASX) still looks to be in a major uptrend, though the Index did not take out its December high of 20.204.58 during January. Theoretical Positions: Long-term investors are likely still long and keeping an eye on a reversal taking the index below its previous 4-month low of 17,770.62 from October 2024. The Index closed January at 19,627.44, up 316.65 for the month.
The US 10-year T-note (ZN) is not as clear a read as it has been since the completion of the bullish 2-month reversal during October and November of 2023. For now, though, I’ll continue to call the major trend up based on the definition of higher highs and higher lows, until the ZN takes out its previous monthly low of 107-040 from April 2024. The market posted a low of 107-060 during January before closing at 108-270, up 0-030 for the month. Theoretical Positions: New longs might’ve been established near the November 2023 close of 109-150. Additional positions could’ve been established near the April close of 107-140. Another round of long positions could’ve been put in place during August as the ZN took out its Wave 1 high. Additional longs could be established near the November close, raising the overall position average to roughly 110-250. Sell stops would be below the previous low of 107-040.