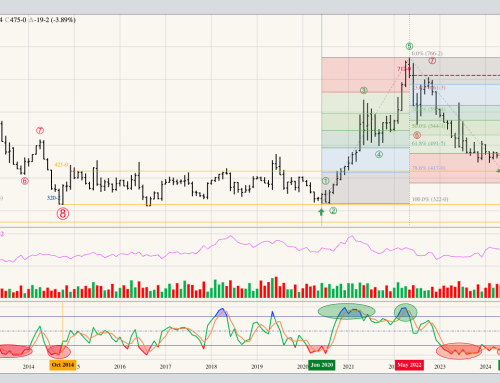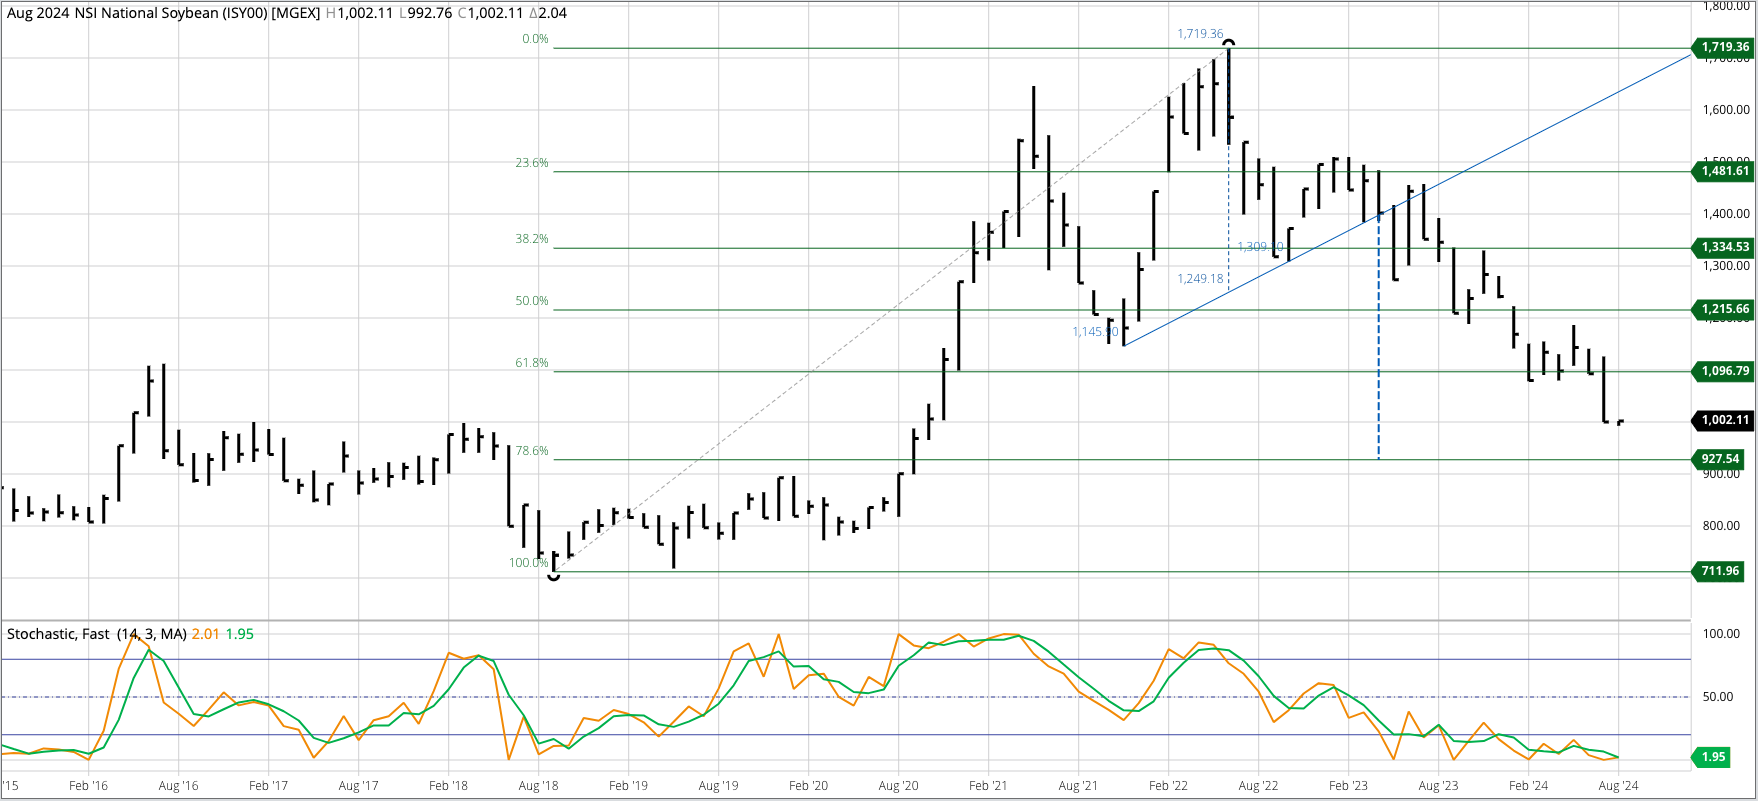


Soybean Cash Index: The National Soybean Index (ISY00, national average cash price) fell to a new low of $10.0001 during July before closing at $10.0007, down 93.16 cents for the month. However, having completed its long-term head and shoulder pattern, the index is in position for a possible bullish reversal during August. Theoretical Positions: Remaining cash bushels from the 2023 harvest would’ve been sold on sell stops below the October low of $11.8872. End users could extend their cash coverage based on the slowly building major uptrend . If long-term long positions were established near the March settlement of $11.34, sell stops would be below the February low of $10.78. Keep in mind the long-term downside target for the NSI on its monthly close-only chart was near $10.26. The index finished July near $10.00.
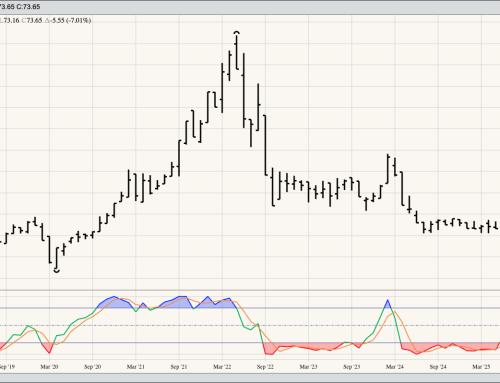
November Soybeans: The November 2024 contract extended its major downtrend during July to a low of $10.15 before closing at $10.2250, down 81.5 cents for the month. However, the contract is again in position to complete a bullish reversal pattern on its monthly chart during August. Theoretical Positions: If traders went long Nov24 in early April near the March settlement of $11.8625, they would’ve been stopped out below the February low of $11.2275. These same traders may have rolled into new short futures at the same time.
The Teucrium Soybean Fund (SOYB) extended its major downtrend to a low of $22.11 before closing July at $22.30, down $1.35 for the month. Again, the fund is in position for a potential bullish reversal during August. Theoretical Positions: Investors are likely on the sidelines, waiting for completion of a bullish reversal pattern, confirming a move to a new major uptrend.