The end of August also meant the end of 2021-2022 Q1 for US wheat markets, though I know spring wheat harvest is not completed yet. Using the weighted average I’ve created for the three major cmdty National Wheat Price Indexes, the end of Q1 saw an average price of $6.75 (green line), up from the end of July’s $6.43 and towering above the previous August’s calculation of $4.39. The latest figure correlates to a stocks-to-use figure of 27.5% (orange column), a solid drop from last month’s 30.0% and the lowest end of month number I have dating back through late in the 2019-2020 marketing year. This is a bullish situation that continues to grow more so with each passing month.
However, it is also in direct contrast to what we see in the Chicago (SRW) wheat futures spreads at the end of August (see Cost of Carry table as second attachment on website). Why focus on the Chicago spreads when SRW is the third largest class of wheat grown in the United States? Because Chicago futures are the most heavily traded wheat futures in the world, making the spreads a better indicator of global supply and demand. And therein lies a possible answer to the divergence between these two key fundamental reads.
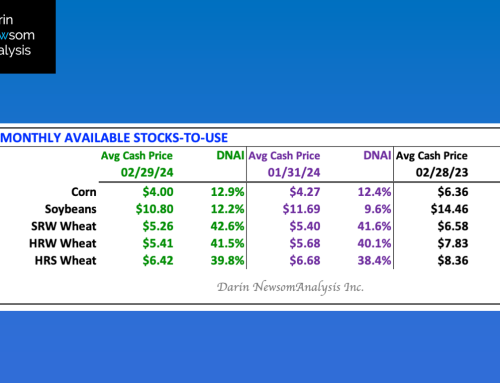
The strength of the weighted national average cash price is a reflection of continued strong basis in the US. This is indeed a result of tight supplies, particularly in HRS wheat that immediately provides support to the HRW market. The weak link is SRW, though it has been propped up as well. On the other hand, the strong carry in Chicago futures spreads continues to indicate the global supply and demand situation may not be as tight as the majority of folks in the industry want to keep talking about. Time will tell, of course.