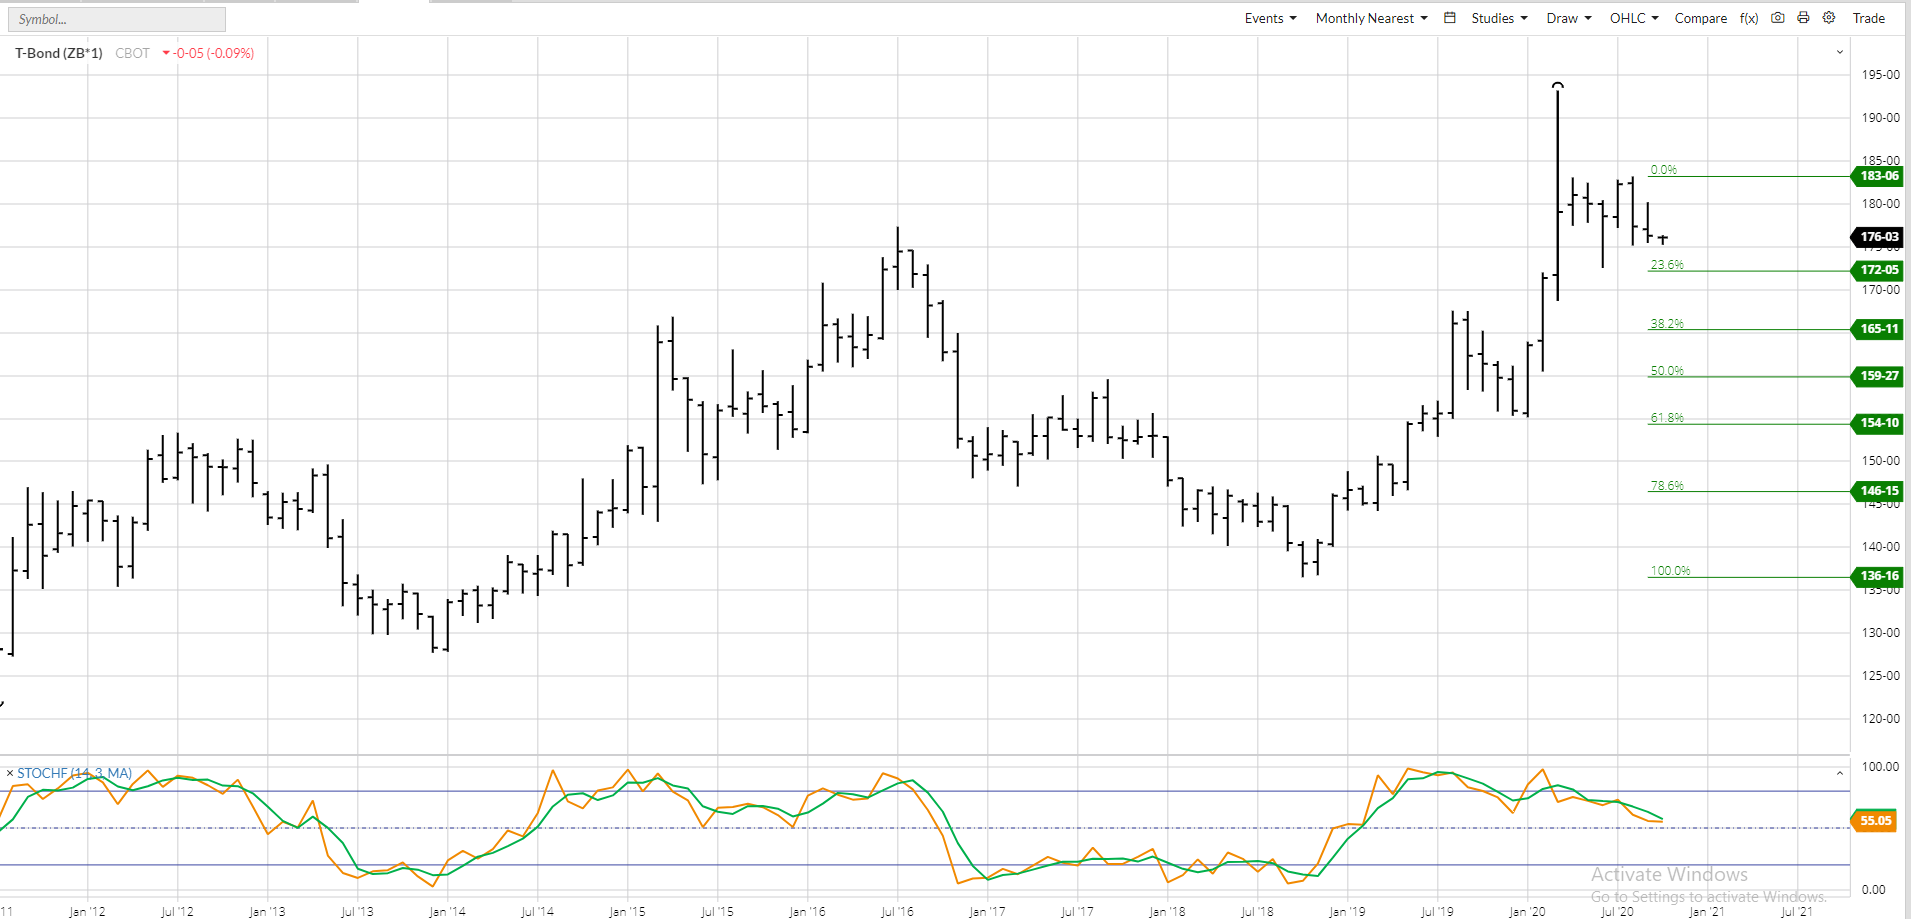
Another month has come and gone and US 30-year T-Bond futures continue to hang precariously above support at on the continuous monthly chart. The September low was 175-14, slightly above the August low of 175-05, with both holding above the 4-month low of 172-17 from June. Even if I throw out the craziest of this past March, the month when so many markets went haywire, I see what should be a major (long-term) downtrend. Monthly stochastics posted a bearish crossover above the overbought level of 80% all the way back in July 2019 indicating the major trend should be turning down. Following a bullish outside range posted this past January, the next major pattern was a bearish key reversal during August (again, throwing out the month of March). This confirmed a new major downtrend was in place, and we’ve seen stochastics indicate downside momentum, the market just hasn’t moved all that much. Based on my analysis of the overall market cycle (discussed in my Weekly Column, “Ebb and Flow”):
- Bonds have peaked (August 2020)
- Stocks peaked (September 2020)
- The US dollar looks to have moved into an major uptrend (September 2020)
- Gold looks to be in the process of establishing a major top
- Which would then be followed by a commodities in general peaking