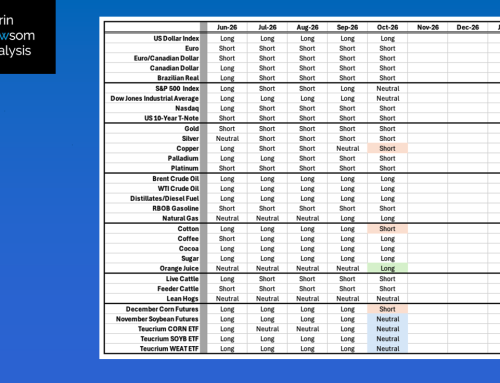
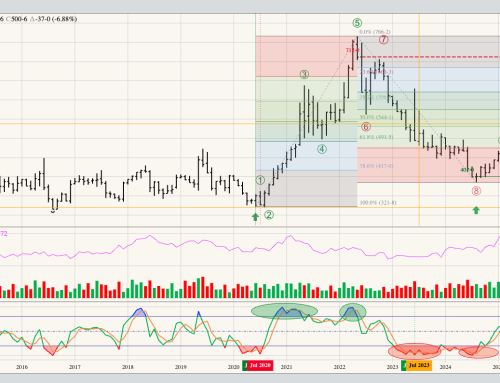
The S&P 500 ($INX) extended its major (long-term) uptrend to a high of 7,816.70 during August before closing at 7,686.14, up 196.42 (2.6%) for the month. Theoretical Positions: Investors likely bought back into the Index durning April.
The Dow Jones Industrial Average ($DOWI) extended its major uptrend to a high of 54,744.33 during August before closing at 53,185.90, up 700.87 (1.3%) for the month. Theoretical Positions: Investors are likely long blue chip stocks, but keeping an eye out for a potential bearish technical reversal pattern due to expectation for rate hikes to come (see below).
The Nasdaq ($NASX) still looks to be in a major downtrend. The Nasdaq completed a bearish spike reversal during June. Theoretical Positions: Investors might’ve sold some of their holdings near the June settlement of 26,213.72 based on the completion of a bearish spike reversal pattern.
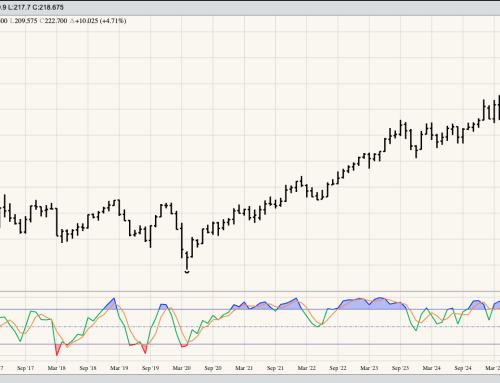
The US 10-year T-note (ZN): The 10-year T-note remains in a major downtrend, closing August at 107-290, down 0-030 for the month. Theoretical Positions: Investors may have gone short the 10-year near the March close of 111-015 based on that month’s bearish outside range.
The Fed Fund Futures Forward Curve: At the close of August the curve dropped, with the October contract settling at 96.20 indicating the a 25-basis point rate hike in October, with another possible in January 2027. This would still fit with the downtrend in US Treasury futures (see 10-year T-note above) and what is still considered an uptrend in the US dollar index (see Currencies).