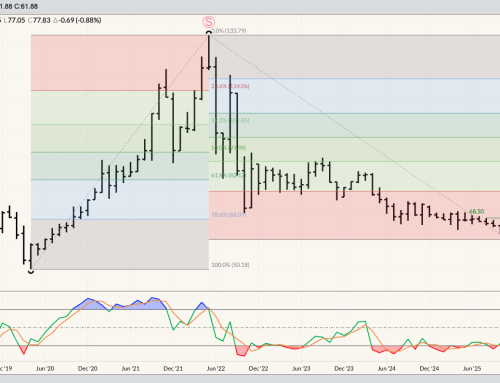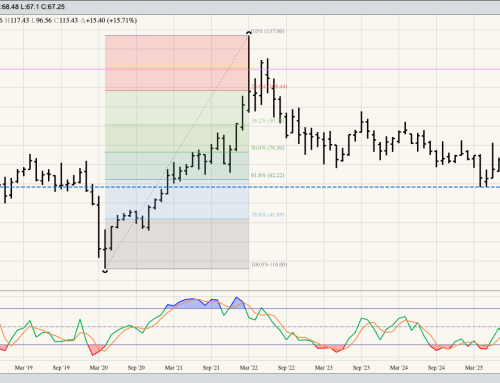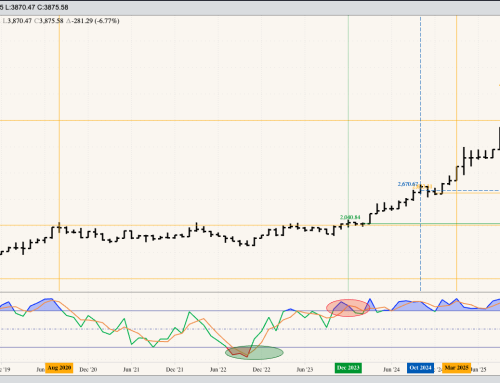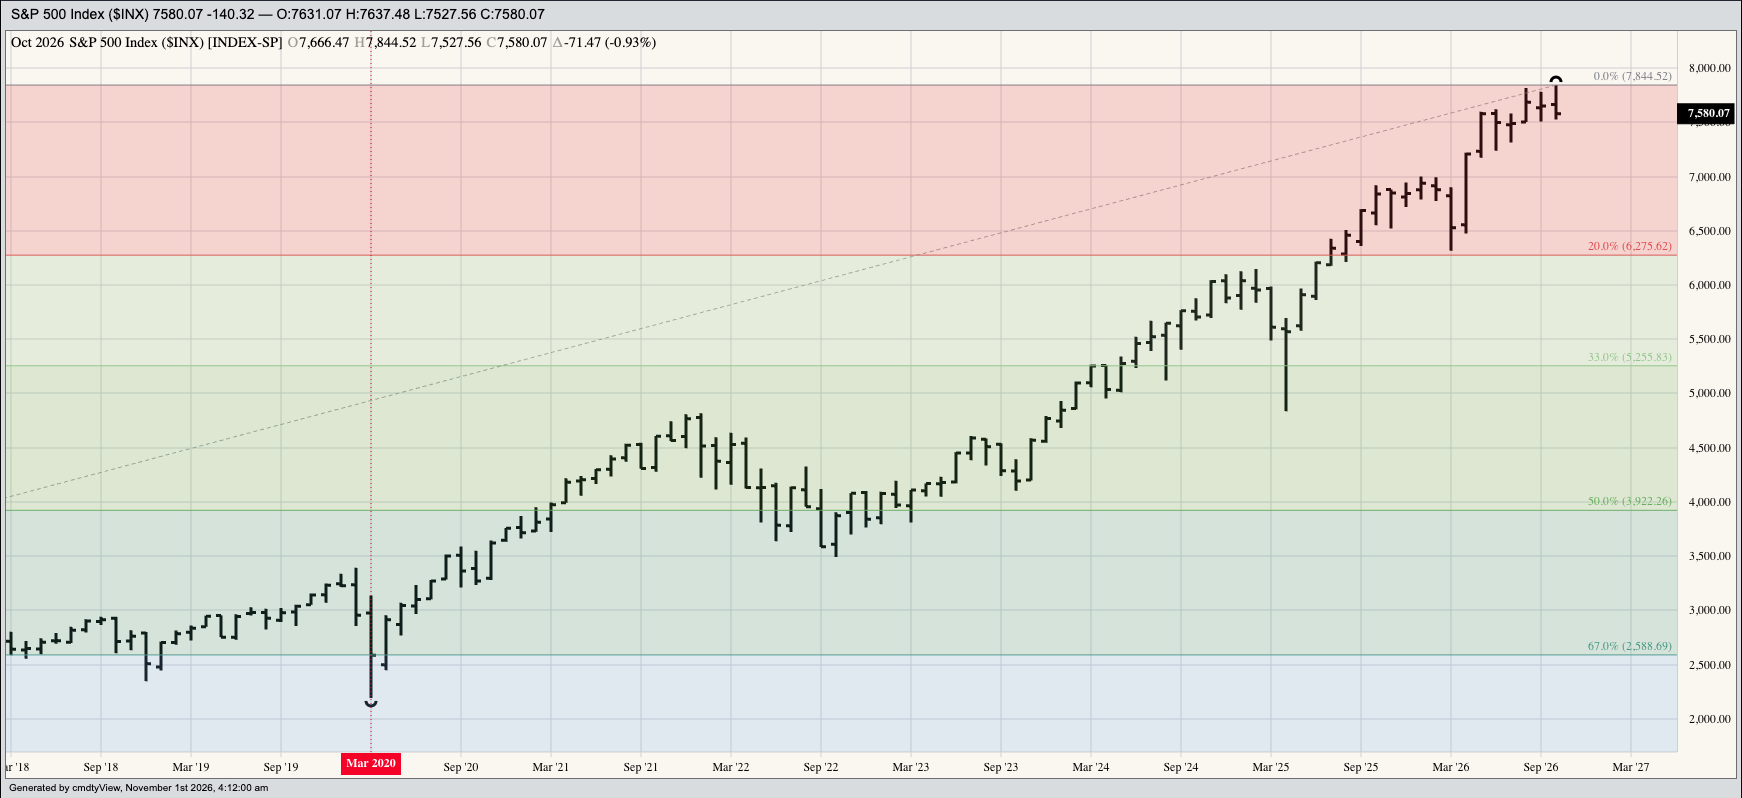


The S&P 500 ($INX) posted a new all-time high of 7,844.52 during October before selling off late, closing at 7,580.07, down 71.47 (0.93%) for the month. Technically, this completed a bearish spike reversal on the Index’s long-term monthly chart indicating the major trend has turned down. Theoretical Positions: Investors who bought back into the Index durning April could look at liquidating holdings based on the idea of higher interest rates and the completion of a bearish technical reversal pattern during October.
The Dow Jones Industrial Average ($DOWI) extended its selloff to a low of 50,546.54 before rallying late in October, settling at 51,770.31, up 864.26 (1.7%) for the month. Theoretical Positions: Investors are likely long blue chip stocks. However, this could be the long-term topping pattern due to expectations for additional interest rate hikes. Heading into November, the previous 4-month low is the October mark.
The Nasdaq ($NASX) confirmed a major downtrend by completing a bearish key reversal on its long-term monthly chart. As October came to an end, the Index took out the September low of 25,805.74 before settling at 25,437.00, down 1,424.06 (5.3%) for the month. The bearish 20% retracement level is down at 22,176.90. Theoretical Positions: Investors might’ve sold some of their holdings near the June settlement of 26,213.72 based on the completion of a bearish spike reversal pattern, with additional liquidation seen during October.
The US 10-year T-note (ZN): The 10-year T-note extended its major downtrend to a low of 103-285 during October, its lowest price since April 2002. However, the end of the month saw US Treasury futures post a spike rally as money came out of equities and into Treasuries. The 10-year finished October at 106-205, up 2.34% for the month, completing a bullish spike reversal on its long-term chart. Theoretical Positions: Investors may have gone short the 10-year near the March close of 111-015 based on that month’s bearish outside range. These positions could be lifted near the October settlement of 106-205 based on the completion of a bullish spike reversal.
The Fed Fund Futures Forward Curve: On a vote of 10-2, the US Federal Open Market Committee left the Fed fund rate unchanged between 3.75% and 4.0% (96.25 and 96.00 on the chart) at the conclusion of the October meeting. Looking ahead, the curve continues to indicate another 25-basis point rate hike in December, with no Fed meeting in November. Another 25-basis point rate hike is expected next April. The situation remains volatile and the curve continues to change rapidly. Heading into the latest FOMC meeting the market was indicating three rate hikes over the next year.