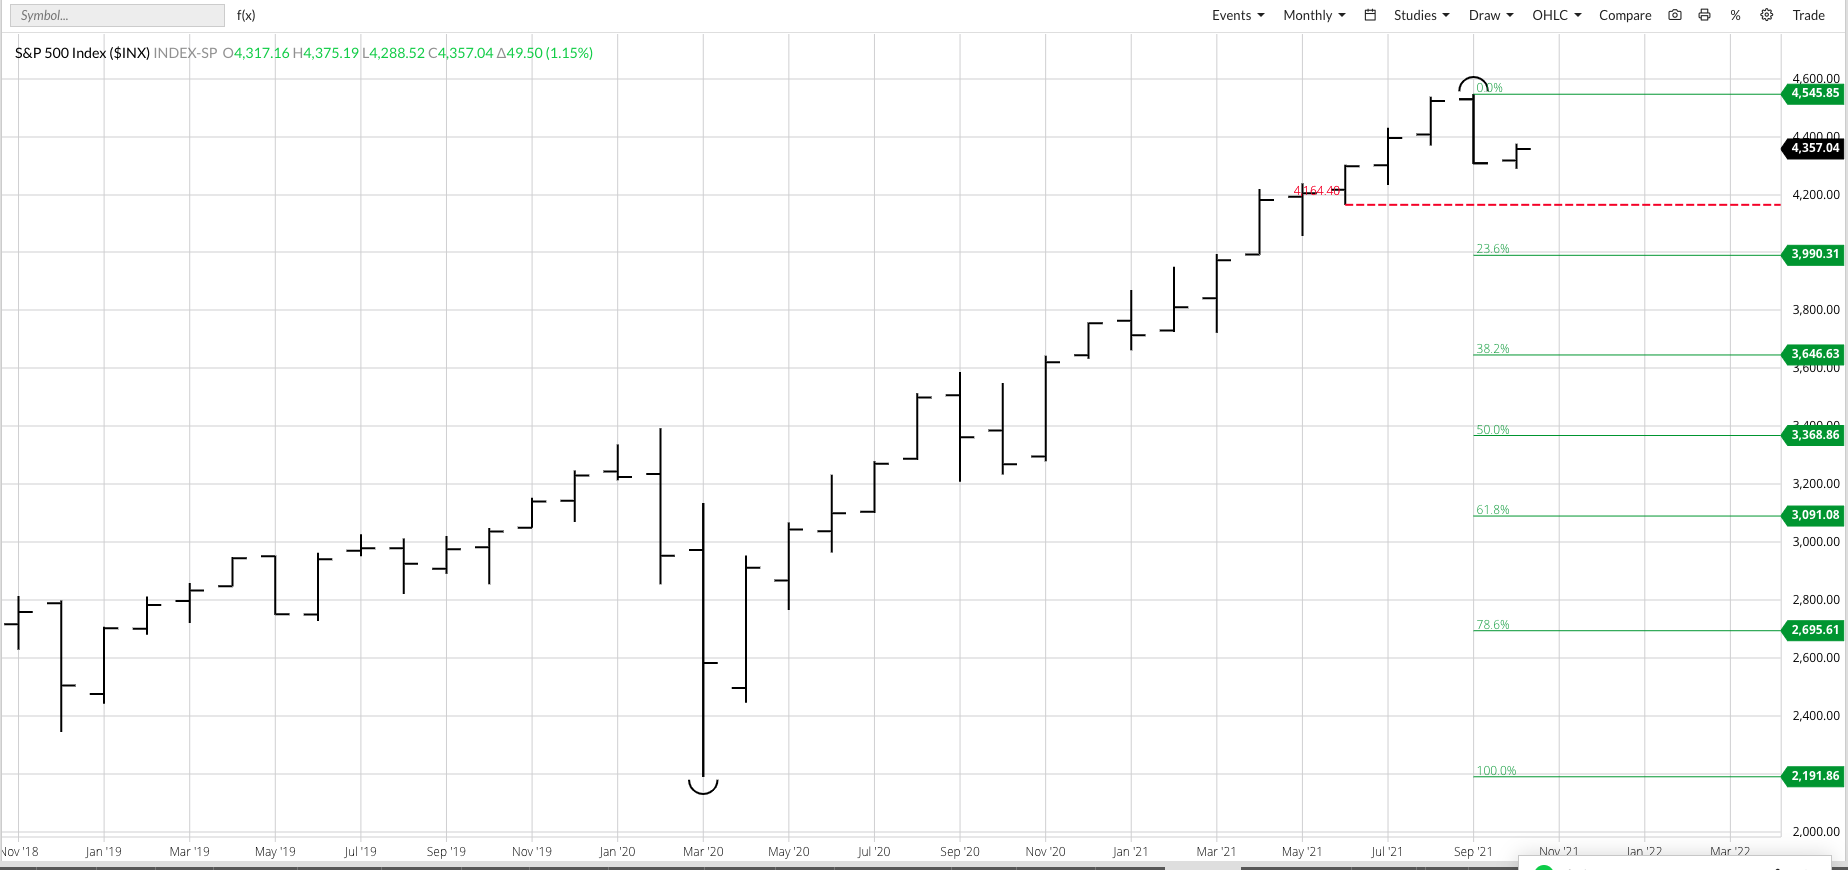
Let’s spend some time talking about the S&P 500 index ($INX). From a technical point of view, this key US stock index clearly posted a bearish key reversal during September having posted a new record high of 4,545.85 before falling below the August low of 4,369.41 and closing at 4,307.54, just off the September low of 4,305.91. Technically, this as bearish a pattern as you are likely to see in any market, and realistically it should lead to at least at 38.2% retracement of the previous major (long-term) uptrend if not 50% or more. But there are a couple problems with that analysis:
- First, where do we begin the previous uptrend? We could take it back to the early 1980s, or possibly the low from March 2009. Just to pick a point, I chose the March 2020 low of 2,191.86 because so many markets changed that month. Using that as a guide, the downside target are:
- 38.2% retracement = 3,646.43
- 50.0% retracement = 3,368.85
- 61.8% retracement = 3,091.08
- Realistically, I’m only going to focus on the 38.2% mark and even that might be way too low. initial support is at the previous 4-month low of 4,164.40
- and the computer generated 23.6% retracement level is 3,990.31, near the low April 2021 low of 3,992.78.
- Second, we can’t forget about Newsom’s Market Rule #7 that tells us “Stock markets go up over time.” It would take something serious to collapse the $INX all the way back to its 38.2% retracement level. It could happen, as we’ve seen in the past, but it might have to be tied to a Chaos event of some kind.
Speaking of which, October 19, 2021 will be the 34-year anniversary of Black Monday 1987, the event that got me started as a market analyst. We will have to find a way to celebrate this year. Stay tuned.